
What is Power BI?
- The Tech Platform

- Nov 26, 2022
- 4 min read
Updated: Nov 28, 2022
In this article, we will give you a brief introduction to Power BI. This includes the Architecture, Application, Advantages, and Disadvantages of Power BI.

What is Power BI?
Power BI is a collection of software services, apps, and connectors that work together to turn your unrelated sources of data into coherent, visually immersive, and interactive insights. Your data may be an Excel spreadsheet or a collection of cloud-based and on-premises hybrid data warehouses. Power BI lets you easily connect to your data sources, visualize and discover what's important, and share that with anyone or everyone you want.
The architecture of Power BI

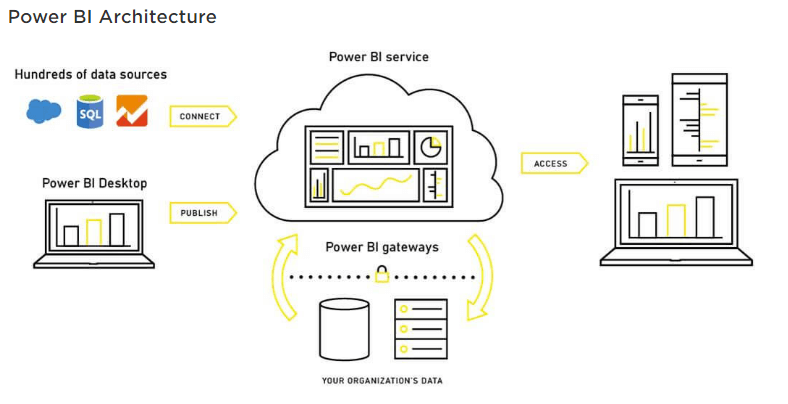
Data Integration:
An organization needs to work with data that comes from different sources which can be in various file formats. The data should be extracted from a different source which can be from different servers or databases. This data is integrated into one standard format in a common staging area.
Data Processing:
In this stage, the integrated data is still not prepared for visualization as the data needs processing. This data is pre-processed. For example, redundant values, and missing values will be removed from the data set.
The business rule should be applied to the data when the data is cleaned. You can load that data back to Data Warehouse.
Data Presentation
Once the data is loaded and processed, it can be visualized much better with use of various visualization that Power Bi has to offer. Use of dashboard and report helps one represent data more intuitively. This visual report helps business end users to take business decision based on the insights.
Power BI Components
Below are the Power BI components:
Power BI Desktop: Power BI Desktop is a free, self-service data analysis and reports authoring tool that you install on a Windows computer. It can connect to more than 70 on-premises and cloud data sources to turn information into interactive visuals. Data scientists and developers work with Power BI Desktop to produce reports and make them available to the Power BI service.
Power BI service: Power BI service is a secure Microsoft - hosted cloud service that lets users view dashboards, reports, and Power BI apps — a type of content that combines related dashboards and reports — using a web browser or via mobile apps for Windows, iOS, and Android.
Power BI mobile apps:
Power BI has mobile apps for iOS, Android, and Windows 10 mobile devices that let users connect to and interact with data.
Power BI Report Server:
Report Server is an on-premises report server. You can create reports in Power BI Desktop or Pro, and viewers can use Report Server to access those reports on a web browser or mobile device, or they can receive them as an email. A report Server would be useful for a company that has restrictions on cloud usage.
Download and Install Power BI Desktop
Microsoft Power BI Desktop is available for 32-bit (x86) and 64-bit (x64) platforms. You can download it according to your system requirements.
STEP 1: Open a browser and go to the Power BI Desktop page.
STEP 2: In the upper right corner, click on settings. Click on Download and select Power BI Desktop.

STEP 3: Now, you are landed on the Microsoft store. Click Get.

STEP 4: Double-click on the setup to start the installation. Click Next.

STEP 5: Accept the terms and conditions check the box and click on Next.
STEP 6: Select the path where you want to download the file. Click Next.
STEP 7: Then click on Finish.
STEP 8: Once the installation is over, you can search for Power BI Desktop in the system and you can see like below:

Applications of Power BI:
Un-complicated setup, no required training, and included dashboards for services such as Salesforce, Google Analytics, and Microsoft Dynamics.
Analysts upload reports and visualization to Power BI Service, and their data is refreshed whenever the underlying dataset is updated.
The app navigation feature helps to customize navigation to help viewers find content quickly.
Users can verbally ask questions to access charts and graphs.
Power BI users can access image recognition and text analytics, create machine learning models, and integrate with Azure Machine Learning.
Advantages of Power BI:
Free to use if you want to build reports for yourself.
Easy to use. You just need the basic knowledge of Excel Pivot tables with Excel's data visualization.
Microsoft releases updates to Power BI monthly.
Easy to submit suggestions for improvements. People can rank the suggestions making it more likely that common requests make it into the next release.
Can read data from Microsoft Excel and text files like XML and JSON.
Ability to save data to Excel. No matter how great a data visualization tool is.
Power BI is full of tools, and widgets that make the data come alive. It also has many types of graphs and charts.
Disadvantages of Power BI:
Dashboards and reports are only shared with users who are having the same email domains.
Power BI will not merge imported data that is accessed from real-time connections.
Power BI only accepts a file size maximum of 250 Mb and the zip file which is compressed by the data of the x-velocity in-memory database.
Dashboard never accepts or passes user, account, or any other entity parameters.
Very few data sources permit real-time connections to Power BI reports and dashboards.
Sofia Sondh
The Tech Platform


Comments