
Machine Learning in Power BI using PyCaret
- The Tech Platform

- Aug 3, 2021
- 4 min read
A step-by-step tutorial for implementing machine learning in Power BI within minutes
Power BI is a business analytics solution that lets you visualize your data and share insights across your organization, or embed them in your app or website. In this tutorial, we will use Power BI Desktop for machine learning by importing the PyCaret library into Power BI.
Before we start
If you have used Python before, it is likely that you already have Anaconda Distribution installed on your computer. If not, click here to download Anaconda Distribution with Python 3.7 or greater.

Setting up the Environment
Before we start using PyCaret’s machine learning capabilities in Power BI we have to create a virtual environment and install pycaret. It’s a three-step process:
Step 1 — Create an anaconda environment
Open Anaconda Prompt from start menu and run the following code:
conda create --name myenv python=3.6

Anaconda Prompt — Creating an environment
Step 2 — Install PyCaret
Run the following code in Anaconda Prompt:
conda activate myenv
pip install pycaret
Installation may take 10 – 15 minutes.
Step 3 — Set Python Directory in Power BI
The virtual environment created must be linked with Power BI. This can be done using Global Settings in Power BI Desktop (File → Options → Global → Python scripting). Anaconda
Environment by default is installed under:
C:\Users\username\AppData\Local\Continuum\anaconda3\envs\myenv

File → Options → Global → Python scripting
Example 1 — Clustering in Power BI
Clustering is a machine learning technique that groups data points with similar characteristics. These groupings are useful for exploring data, identifying patterns and analyzing a subset of data. Some common business use cases for clustering are:
Customer segmentation for the purpose of marketing.
Customer purchasing behavior analysis for promotions and discounts.
Identifying geo-clusters in an epidemic outbreak such as COVID-19.
In this tutorial we will use ‘jewellery.csv’ file that is available on PyCaret’s github repository. You can load the data using a web connector. (Power BI Desktop → Get Data → From Web).

Power BI Desktop → Get Data → Other → Web

Sample data points from jewellery.csv
K-Means Clustering
To train a clustering model we will execute Python script in Power Query Editor (Power Query Editor → Transform → Run python script).

Ribbon in Power Query Editor
Run the following code as a Python script:
from pycaret.clustering import *
dataset = get_clusters(data = dataset)
Power Query Editor (Transform → Run python script)
Output:
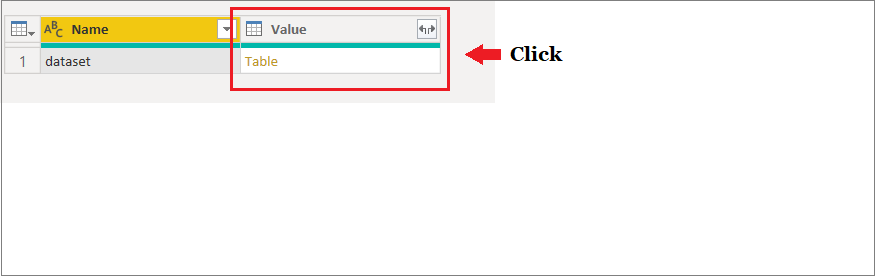
Clustering Results (after execution of code)

Final Output (after clicking on Table)
A new column ‘Cluster’ containing label is attached to the original table.
Once you apply the query (Power Query Editor → Home → Close & Apply), Here is how you can visualize the clusters in Power BI:

By default, PyCaret trains a K-Means clustering model with 4 clusters (i.e. all the data points in the table are categorized into 4 groups). Default values can be changed easily:
To change the number of clusters you can use num_clusters parameter within get_clusters( ) function.
To change model type use model parameter within get_clusters( ).
See the following example code of training K-Modes model with 6 clusters:
from pycaret.clustering import *
dataset = get_clusters(dataset, model = 'kmodes', num_clusters = 6)
There are 9 ready-to-use clustering algorithms available in PyCaret:

All the preprocessing tasks necessary to train a clustering model such as missing value imputation (if table has any missing or null values), or normalization, or one-hot-encoding, they all are automatically performed before training a clustering model. Click here to learn more about PyCaret’s preprocessing capabilities.
💡 In this example we have used the get_clusters( ) function to assign cluster labels in the original table. Every time the query is refreshed, clusters are recalculated. An alternate way to implement this would be to use the predict_model( ) function to predict cluster labels using a pre-trained model in Python or in Power BI (see Example 5 below to see how to train machine learning models in Power BI environment).
💡 If you want to learn how to train a clustering model in Python using Jupyter Notebook, please see our Clustering 101 Beginner’s Tutorial. (no coding background needed).
Example 2 — Anomaly Detection in Power BI
Anomaly Detection is a machine learning technique used for identifying rare items, events, or observations by checking for rows in the table that differ significantly from the majority of the rows. Typically, the anomalous items will translate to some kind of problem such as bank fraud, a structural defect, medical problem or error. Some common business use cases for anomaly detection are:
Fraud detection (credit cards, insurance, etc.) using financial data.
Intrusion detection (system security, malware) or monitoring for network traffic surges and drops.
Identifying multivariate outliers in the dataset.
In this tutorial we will use ‘anomaly.csv’ file available on PyCaret’s github repository. You can load the data using a web connector. (Power BI Desktop → Get Data → From Web).

Sample data points from anomaly.csv
K-Nearest Neighbors Anomaly Detector Similar to clustering, we will run Python script from Power Query Editor (Transform → Run python script) to train an anomaly detection model. Run the following code as a Python script:
from pycaret.anomaly import *
dataset = get_outliers(data = dataset)
Power Query Editor (Transform → Run python script)
Output:

Anomaly Detection Results (after execution of code)

Final Output (after clicking on Table)
Two new columns are attached to the original table. Label (1 = outlier, 0 = inlier) and Score (data points with high scores are categorized as outlier).
Once you apply the query, here is how you can visualize the results from anomaly detection in Power BI:

By default, PyCaret trains a K-Nearest Neighbors Anomaly Detector with 5% fraction (i.e. 5% of the total number of rows in the table will be flagged as outlier). Default values can be changed easily:
To change the fraction value you can use fraction parameter within get_outliers( ) function.
To change model type use model parameter within get_outliers( ).
See the following code for training an Isolation Forest model with 0.1 fraction:
from pycaret.anomaly import *
dataset = get_outliers(dataset, model = 'iforest', fraction = 0.1)
There are over 10 ready-to-use anomaly detection algorithms in PyCaret:

Source: Towards Data Science by - Moez Ali
The Tech Platform


Comments