
Understanding Data Mart in Power BI
- The Tech Platform

- Jun 6, 2024
- 6 min read
In the world of data analysis and business intelligence, Power BI stands as a leading tool. Developed by Microsoft, Power BI is a business analytics tool that delivers insights throughout your organization. It provides interactive visualizations with self-service business intelligence capabilities, enabling end users to create reports and dashboards, without having to depend on information technology staff or database administrators.
However, as organizations grow and data becomes more complex, there can be challenges in managing and analyzing this data effectively. This is where the concept of a Data Mart comes into play.
A Data Mart is a subset of a data warehouse that is designed to cater to the needs of a specific business unit or team, such as sales, finance, or marketing. By creating a Data Mart, businesses can provide these teams with faster and more efficient access to the data they need most, without having to sift through irrelevant data in the main data warehouse.
In this article, you will learn about
The definition and purpose of a Data Mart.
How it fits into the larger picture of business intelligence.
How to implement Data Mart to enhance your data analysis and reporting capabilities.
Discuss the benefits of using a Data Mart.
Provide practical examples to help you understand these concepts better. 😊
Understanding Data Mart
A Data Mart is a specialized subset of a data warehouse that focuses on a specific business. It is designed to help a particular department or business unit make informed decisions by providing easy access to a specific data set. For example, a retail company might have separate data marts for its sales, marketing, and inventory departments, each containing only the data relevant to that department.
In the context of Power BI, a Data Mart can be a curated set of data specifically structured for reporting and visualization. It’s like having a smaller, more focused data warehouse optimized for a specific set of Power BI reports and Power BI dashboards.
Data Mart Features
Data Mart in Power BI offers several key features that enhance the data analysis process:
Web-Based Interface: Data Mart is 100% web-based, meaning you can access it anywhere.
No-Code Experience: It provides a no-code experience, making it accessible to users without a technical background.
Fully Managed Datamart: The datamart is fully managed, meaning you don’t have to worry about the underlying infrastructure or database management.
Automated Performance Tuning: It automatically tunes performance, ensuring your data queries run efficiently.
Built-In Visual and SQL Query Editor: It is a built-in visual and SQL Query editor for ad-hoc analysis.
Support for SQL and Other Popular Client Tools: It supports SQL and other popular client tools, making it versatile and flexible.
Native Integration with Power BI and Microsoft Office: It integrates natively with Power BI, Microsoft Office, and other Microsoft analytics offerings.
End-to-end Data Ingestion, Preparation, and Exploration: It provides end-to-end data ingestion, preparation, and exploration with SQL, including no-code experiences.
Semantic Models and Reports Building: It enables building semantic models and reports within one holistic experience.
Automated Performance Tuning: It offers automated performance tuning to optimize data retrieval and analysis.
Data Mart vs Data Warehouse
Understanding the difference between a Data Mart and a Data Warehouse is crucial for effective data management and analysis. These two concepts are fundamental in Business Intelligence and Data Analysis, and using them appropriately can significantly enhance your ability to derive meaningful insights from your data.
Differentiating between a Data Mart and a Data Warehouse helps to choose the right tool for the right job. Both are used for storing data but have different purposes, scopes, and usage.
Data Mart | Data Warehouse | |
Definition | A subset of a data warehouse that is designed to cater to the needs of a specific business unit or team. | A large, centralized repository of data collected from various sources, is used to guide business decisions. |
Scope | Focused on a specific area, such as sales, marketing, or finance. | It covers the entire organization and contains data from all departments. |
Data Volume | Contains a smaller volume of data. | Contains a large volume of data. |
Performance | Faster data retrieval due to a smaller volume of data. | Slower data retrieval due to a larger amount of data. |
Users | Specific to a department or a team. | It is used by the entire organization. |
Complexity | Less complex due to its limited scope. | More complex due to its wide scope and large volume of data. |
Integration with Power BI | Used to create focused Power BI reports and Power BI dashboards for specific departments. | Used to create comprehensive reports and dashboards in Power BI covering all areas of the business. |
Data Source | Typically source data from a few selected systems relevant to a specific business area. | Sources data from numerous disparate systems across the organization. |
Data Integration | Data is often denormalized, with redundancy allowed to improve performance. | Data is typically normalized, with redundancy eliminated to maintain a single version of the truth. |
Cost | Less expensive to implement and maintain due to its smaller size and scope. | More expensive due to its large size, complexity, and the need for specialized tools and skills. |
Now, let's learn how to create a Data Mart in Power BI
Creating a Data Mart in Power BI
STEP 1: Setting up Workspace
Open your Power BI account and navigate to your workspace. You can create a new one if you don’t have an existing workspace.
To create a new workspace, click “Workspace” in the left panel, then click “+ New workspace”.

Enter a workspace name, for example, “Data Mart Workspace”.

STEP 2: Creating Data Mart
Click on “+ New” and select “DataMart (Preview)”.

A pop-up window will appear. Enter a name for the Data Mart. For instance, if your Data Mart is focused on sales data, you could name it “Sales Insights Mart”. Click "Create".

STEP 3: Loading Data
You can import the data from multiple sources.
We’ll use a sample data source, “Northwind Traders OData feed” for this example.
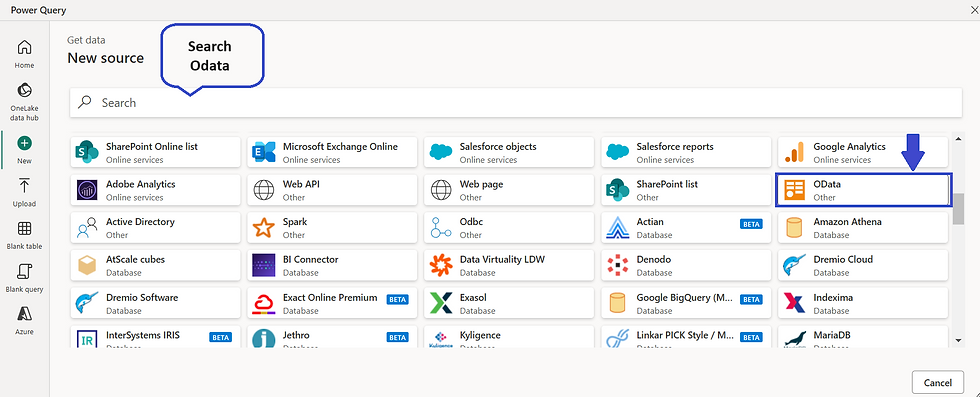
Click on "Get Data". Search OData and then select it.
After that enter the Northwind URL - https://services.odata.org/Northwind/Northwind.svc and then click Next.

Now, select the tables you want to import according to your requirements. For example, search for “sales” and select the Sales tables if you want a data mart for sales data.
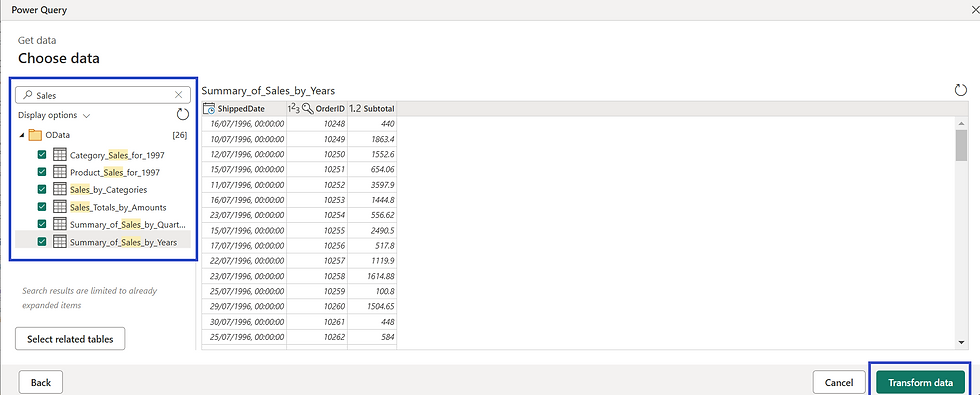
Click “Transform data”. Your data will be transformed and ready for ingestion.
STEP 4: Saving and Viewing Your Data
Click “Save” to ingest the data.

Once your Data Mart creation is complete, the data view will open, and you can see the data ingested in your Data Mart.

Using Data Mart in Power BI
let’s learn how to use a Data Mart in Power BI for data analysis with your sales data.
Understanding Your Data
You have sales data categorized into the following categories:
Beverages
Condiments
Dairy Products
Grains/Cereals
Meat/Poultry
Produce
Seafood
Each category contains various products, and you have sales data for these products.

Using SQL for Data Analysis
You can use SQL queries to analyze this data. For example, the following SQL query will give you the total sales for each product in each category:
SELECT CategoryID, CategoryName, ProductName, SUM(ProductSales) as TotalSales
FROM Sales_by_Categories
GROUP BY CategoryID, CategoryName, ProductName
ORDER BY TotalSales DESC;
This query works by:
Select the CategoryID, CategoryName, ProductName, and the sum of ProductSales from your Sales_by_Categories table.
Group the results by CategoryID, CategoryName, and ProductName. This means it will calculate the total sales (TotalSales) for each product in each category.
Order the results by TotalSales in descending order. This means the products with the highest sales will appear first.
The Results
The result of this query will be a table that shows the CategoryID, CategoryName, ProductName, and TotalSales for each product in each category, ordered by the total sales. This can give you valuable insights into which products sell the most in each category.


Visualizing the Result
Visualizing results in Data Marts refers to creating visual representations of your data for easier understanding and interpretation. This can be done using various Business Intelligence tools, including Power BI.
In Power BI, you can visualize the results once you’ve created a Data Mart and loaded your data. This involves creating charts, graphs, and other visual elements representing your data. These visuals can help you identify patterns, trends, and insights in your data that might not be immediately apparent from the raw data.
After running the query, click "Explore this data (preview)" and then select "Visualise results".

This will open a pane where you can see the name of the SQL query that was just executed and a list of columns associated with the SQL Query.

Drag and drop the columns onto the Visualizations and Filters pane to create your visuals. You can choose from visual types, including bar charts, line graphs, pie charts, etc.
Once you have created your visuals, click "Save as report". This report can then be shared with others, exported, or further edited within your Power BI workspace.
Conclusion
A Power BI Data Mart offers a focused, efficient, and user-friendly way to manage and analyze data.
The importance of using a Data Mart in Power BI lies in its ability to provide specific subsets of data to different departments or teams within an organization. This allows for more targeted and efficient data analysis, leading to more accurate insights and better-informed decision-making.
Data Mart Benefits
The benefits of using a Data Mart in Power BI are numerous:
Efficiency: By providing a subset of data relevant to a specific team or department, a Data Mart reduces the time and effort required to sift through large volumes of irrelevant data.
Performance: As a Data Mart contains less data than a full-fledged data warehouse, data retrieval and analysis are faster and more efficient.
User-Friendly: A Data Mart is generally easier to navigate and understand, making it more user-friendly for non-technical users.
Flexibility: A Data Mart can be tailored to meet the specific needs of different teams, making it a flexible solution for diverse data analysis requirements.
In conclusion, a Data Mart is essential in the data analysis toolkit. When used effectively in Power BI, it can significantly enhance your organization’s ability to derive meaningful insights from data, leading to smarter business decisions and strategies. 😊


Comments