
Dashboards in Microsoft Power BI
- Manpreet Singh

- May 4, 2019
- 4 min read
Welcome readers to an article on Dashboards of Microsoft BI. Dashboards are the main module of Power BI Service, provided to the user end. You can create your own personalized dashboards to view or monitor your real-time data through just one portal.
You can have a dashboard on the Web or on your cell phone. It will provide you with the same data and most importantly no matter how many external services you link to your dashboard, all will be in synchronization, Real-time synchronization.
Isn’t that great!!
Power BI is so powerful as a tool that for the end users, it looks like a cool gadget, which has everything in one place.
Let’s see what it offers.

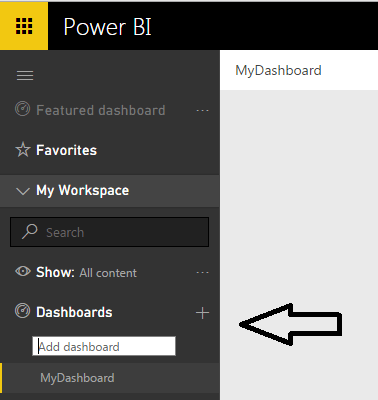
On your Power BI, click My Workspace on the left panel and under Dashboards, click Add dashboard.
Provide a name to your dashboard and it is ready as per the screenshot, given below, as blank, which needs to be filled in.

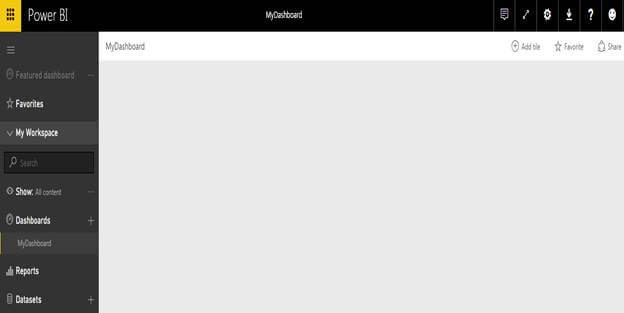
Now it’s like you have a blank chart and you want everything to be in it.
We have a section in the right top corner, which will assist us in doing that.
Starting off with Add tile.
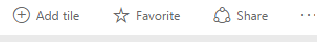
Add tile

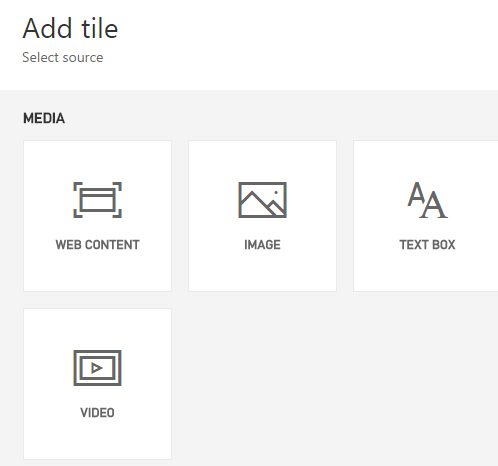
This provides you with a whole lot of Applications to be connected to your dashboard with the help of simple clicks of your mouse.
Let’s see them.
1. WEB Content
This is one of the most amazing features of the Dashboard. For example, I have an embed code to be posted from YouTube or Google calendar or even an HTML button to my dashboard, what do I do?
Simply click Add Tile as Web Content and configure the following fields.

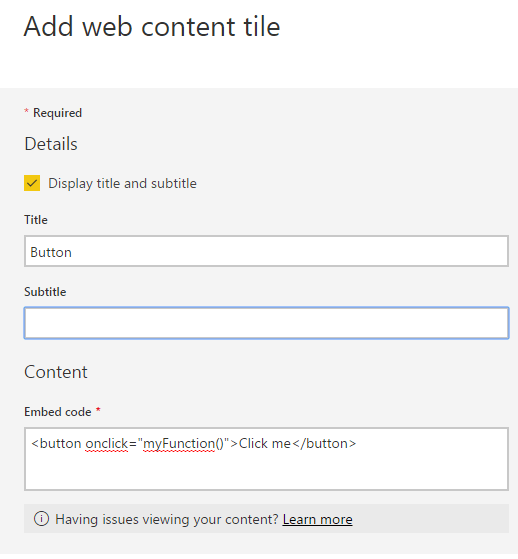

Configuration
Title: Provide a title, if you want to have one, it's not mandatory.
Subtitle: Similarly, provide a subtitle, if you want to have one, it's not mandatory.
Content: The amazing part comes here. You can connect any embedded code and the real-time data comes in directly on your dashboard.
For a demo, I used HTML button code and it loads up.
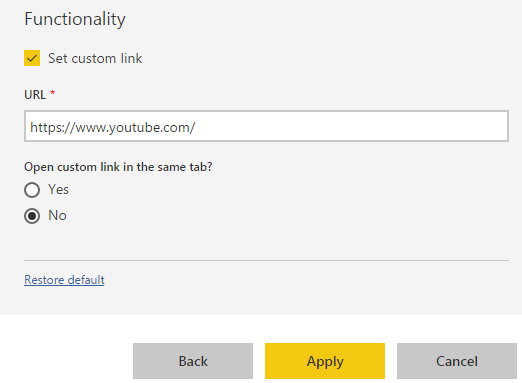
4. Functionality: On clicking the title, if you want it to open something on the same or a new tab, just
configure the Set Custom Link option and on click, it will perform the action.
2. Image
If I want to add an image to the dashboard, just add another tile. Configure the tile and the image will be set as per the screenshot, given below:

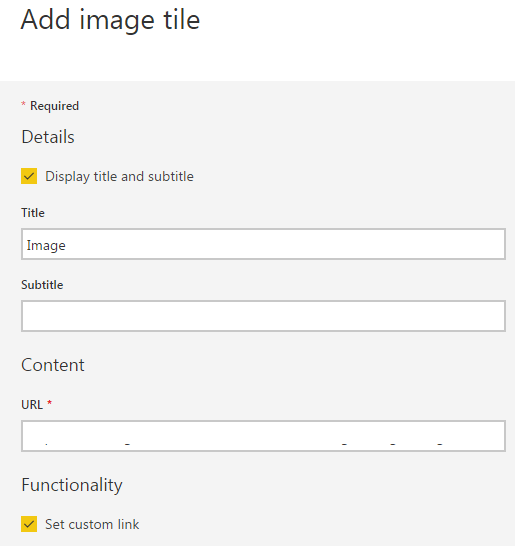

Configuration
Title: Provide a title, if you want to have one, it's not mandatory.
Subtitle: Similarly, provide a subtitle, if you want to have one, it's not mandatory.
Content: Add a link to the image and it will load.
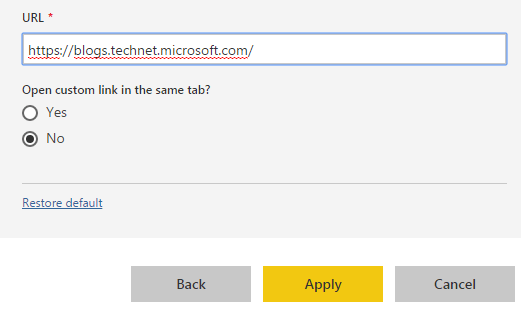
Functionality: On click of the title, if you want it to open something on the same or a new tab, just configure the Set Custom Link option and on click, it will perform the action.
3. Text
Similarly, you can configure your tile with text content.

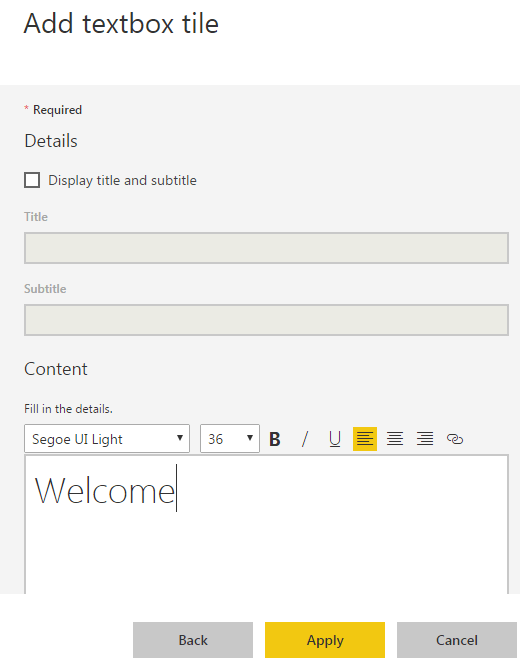
Configuration
Title: Provide a title, if you want to have one, it's not mandatory.
Subtitle: Similarly, provide a subtitle, if you want to have one, it's not mandatory.
Content: Add the text content.
Functionality: On the click of the title, if you want it to open something on the same or a new tab, just configure the Set Custom Link option and on click, it will perform the action.
4. Video File
This is one of the most amazing features of the dashboard. For example, I have a video to be posted from YouTube to my dashboard, what do I do?
Simply, click on Add Tile as Web Content and configure the following fields.

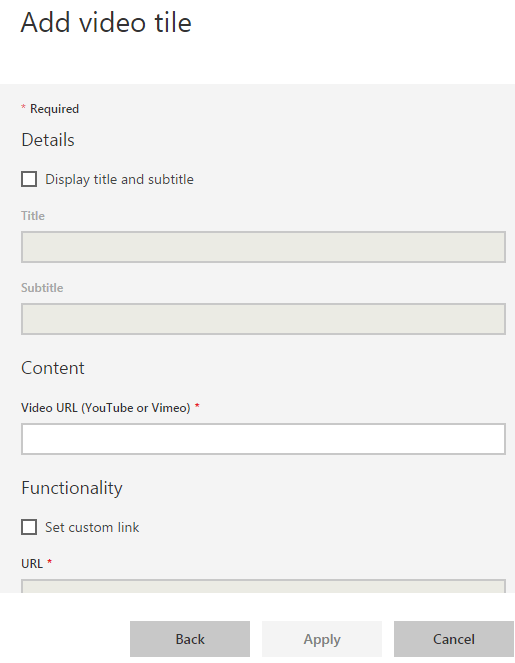
Configuration
Title: Provide a title, if you want to have one, it's not mandatory.
Subtitle: Similarly, provide a subtitle, if you want to have one, it's not mandatory.
Content: For a demo, I have used a video from a YouTube link and it loads.
Functionality: On click of the title, if you want it to open something on the same or a new tab, just configure the Set Custom Link option and on click, it will perform the action.
After configuration, the dashboard is ready for preview.

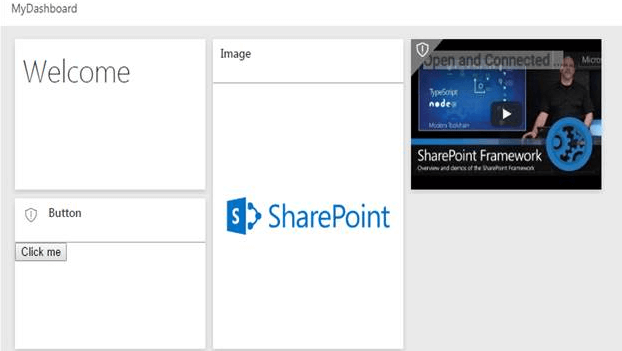
Now comes the best part. You can control the look and feel of the dashboard, just by dragging.
Really, it’s so easy, as you can see in the screenshots, given below. You just have to drag them to your dashboard, where you want to place them or even if you want to change the height or width, just change it on the image slot.

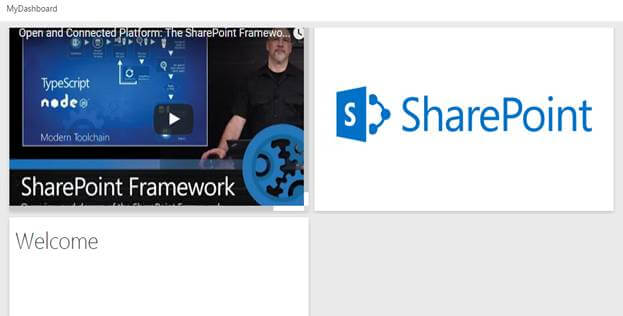

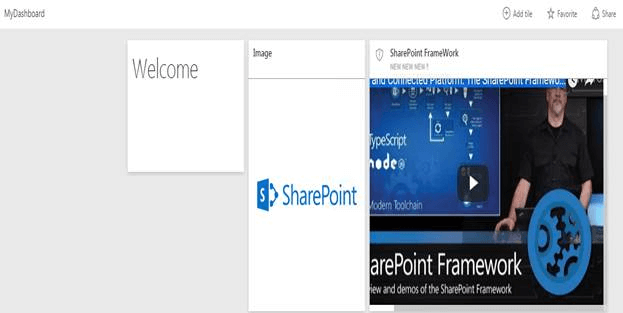
This ease will help you to set up your dashboard very efficiently and much quicker without even writing a single line of code to set up your choice of the dashboard.
Sharing

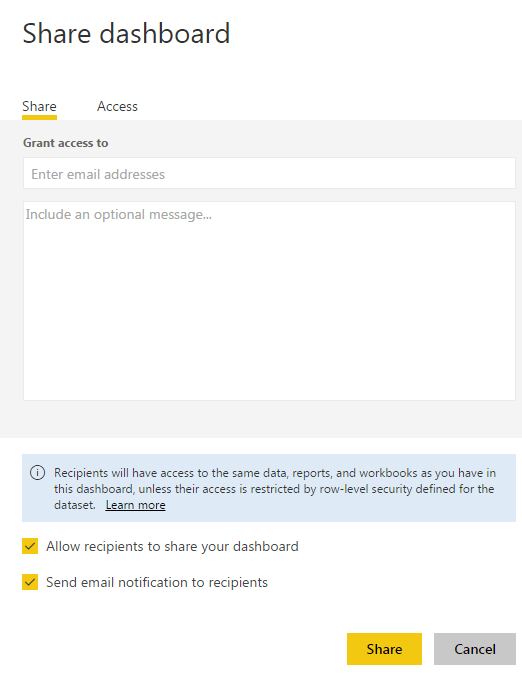
On the right corner, click share and you will see the options, mentioned above.
Enter the Email address of the users with an optional message and click share. They will have direct access to your dashboards, reports and datasets with easy clicks.

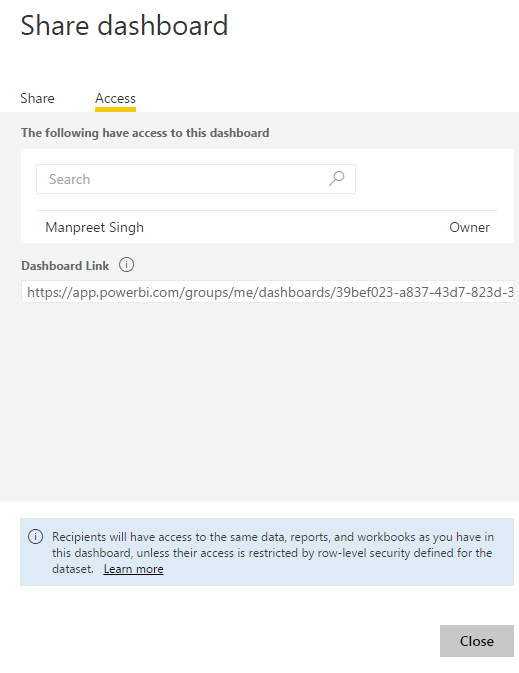
If you want them to view only the dashboard and not the other reports on your Power BI, just click Access under share and provide them access only to your dashboards from here.
Dashboard Actions

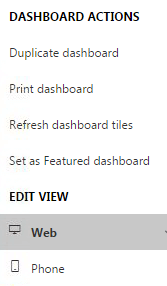
Last but not least of so many features, our dashboard provides the following actions.
Duplicate dashboard: You can duplicate all the content on your dashboard by just clicking on the option.
Print dashboard: You can print your dashboard.
Refresh dashboard tiles: If you are getting real-time data, you can refresh your tiles.
Set as Featured dashboard: It’s like choosing it as favourite.
Edit View.
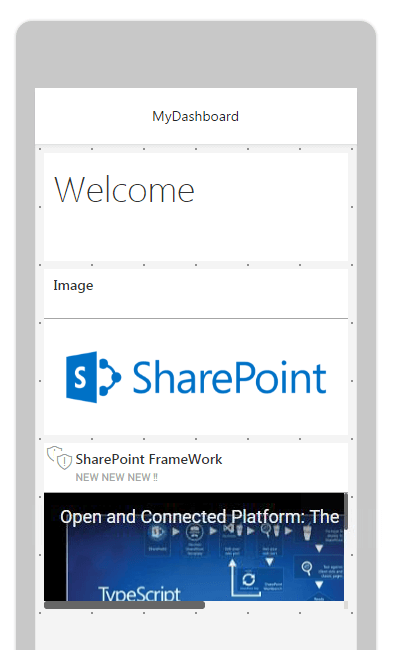
As our dashboard is compatible with both Web and phone devices, you can choose the phone device and configure the look and feel you want to display on the devices, as per the screenshot, given below.

Here, we read an article on the Dashboard of Microsoft Power BI and it is an amazing platform, which can keep you glued when configured, as you can get all the advantages of multiple platforms in one.


Comments