
Introduction to Multilevel Modelling in Machine Learning
- The Tech Platform

- Feb 10, 2022
- 5 min read
Multilevel modelling is a technique for dealing with data that has been clustered or grouped. Data with repeated measures can also be analyzed using multilevel modelling.

Multilevel modelling is a technique for dealing with data that has been clustered or grouped. Data with repeated measures can also be analyzed using multilevel modeling. For example, If we are testing the blood pressure of a group of patients on a weekly basis, we can think of the succeeding measurements as being grouped inside the individual subjects. It can handle data with different measurement periods from one subject to the next. A multilevel model in machine learning can be applied in such cases that models the parameters that vary at more than one level.
Multilevel models are statistical models with many levels of variation. They are also known as hierarchical linear models, linear mixed-effect models, mixed models, nested data models, random coefficient, random-effects models, random parameter models, or split-plot designs.
Many types of data, particularly observational data collected in the human and biological sciences, have a hierarchical or clustered structure. Children with the same parents, for example, have more physical and mental characteristics in common than people chosen at random from the broader population.
Types of Multilevel Model
In a simple regression model, we have an intercept term, a predictor variable multiplied by a slope and a residual term. We assume that each observation is independent of others. It looks something like this
yi = β0 + β1xi + ei
Here, the only term that is variable is the residual term ei while the intercept and the slope are fixed. This is mostly sufficient for data where the basic assumption that each observation is independent of others holds. But in the case of nested data, it generalizes for all the groups. We have a single average line for all the groups.
In multilevel models, we will allow the intercept and co-efficient to vary. Not only we will find the regression parameters describing the overall relationships of predictor and response variables but we also go above and beyond to estimate variances of the coefficients allowed to vary across groups at higher levels. Here, we will discuss two multilevel models
1. Random Intercept Model
In a random intercept model, the intercept term is allowed to vary across the clusters. As the name suggests we will introduce a random variable for the intercept term. The equation looks something like this
yij = β0j + β1xij + eij ….. eq-1
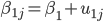
where , β0j = β0 + uj ….. eq-2
Here, i = individual observations j = individual clusters
combining both the equations we get,

where uj ~ N(0,sigmau2) and eij ~ N(0,sigmae2)
Now, let’s understand how this works. In the random intercept model, we introduced a random variable uj to account for the variance caused by clusters. uj is the random variable responsible for unique intercepts for each group. In simple regression, we have a single line that best fits the data but in a random intercept model, we have different regression lines for different groups along with a common regression line. As the equation suggests we will still calculate the coefficients. We are specifically interested in the calculation of the variance of the random intercept term i.e. sigma2u.
In a simple regression model, we have beta0 as intercept. For the random intercept model, beta0 is still the intercept term for the average regression line but for each group the intercept is beta0 + uj. See below diagram the average intercept is beta0 while for the red group it is bata0+u1. uj is the difference between the intercept beta0 and individual groups.

2. Random Coefficient Model
Just as we allowed intercepts to randomly vary in a random intercept model, in a random coefficient model we allow the slope to vary across the groups. In some cases, random intercept alone may not be sufficient to explain variability across the groups. So, a random slope model is needed where each group will have different slopes along with different intercepts. Why is it so? It was observed that explanatory variables might have different effects for each group. Let’s suppose in our school example if admission cutoff is an explanatory variable for test outcome then there might be schools where student scores were highly affected by the previous admission cutoff scores, there might also be some schools, the effect might be less. Here, we can not use the same slope for every group instead each group will have its slope.

The equation for a random slope/coefficient model is given as


Substituting equations we will get

We introduced two random variables u1j and u0j. one for the intercept and the other for the slope. If you haven’t noticed already this uij term is responsible for variation in slopes. And it is the difference between the average slope of the regression line and the slope of the individual groups. Note that we introduced only two random variables beta0 and beta1 but in reality, we will have to calculate six parameters. beta0 and beta1 as usual, are fixed parts responsible for the overall regression line while for the random part we will be estimating sigma2u0 and sigma2u1 the variances of u0j and u1j and sigmau01– covariance of the slopes and intercepts. It is observed that the slopes and intercepts are linked. When the covariance between these two are positive the regression lines will appear diverging, while negative covariance suggests the lines to be converging and zero covariance would suggest no fixed pattern.
Usage of Multilevel Modeling:
Correct inferences: Traditional multiple regression techniques treat the units of analysis as independent observations. One consequence of failing to recognise hierarchical structures is that standard errors of regression coefficients will be underestimated, leading to an overstatement of statistical significance. Standard errors for the coefficients of higher-level predictor variables will be the most affected by ignoring grouping.
Substantive interest in group effects: In many situations a key research question concerns the extent of grouping in individual outcomes, and the identification of ‘outlying’ groups. In evaluations of school performance, for example, interest centres on obtaining ‘value-added’ school effects on pupil attainment. Such effects correspond to school-level residuals in a multilevel model which adjusts for prior attainment.
Estimating group effects simultaneously with the effects of group-level predictors: An alternative way to allow for group effects is to include dummy variables for groups in a traditional (ordinary least squares) regression model. Such a model is called an analysis of variance or fixed effects model. In many cases there will be predictors defined at the group level, eg type of school (mixed vs. single sex). In a fixed effects model, the effects of group-level predictors are confounded with the effects of the group dummies, ie it is not possible to separate out effects due to observed and unobserved group characteristics. In a multilevel (random effects) model, the effects of both types of variable can be estimated.
Inference to a population of groups: In a multilevel model the groups in the sample are treated as a random sample from a population of groups. Using a fixed effects model, inferences cannot be made beyond the groups in the sample.
Advantages of Multilevel Modelling
We can very well use regular regression models in grouped data like the example we gave above by introducing dummy variables. But the multilevel approach has several advantages
Better inferences: A multilevel regression provides better inference from grouped data. A regular regression model does not consider the grouping of data which subsequently leads to underestimation of coefficients and overstatement of coefficient significance.
Fewer parameters: With a regular regression model we need dummy variables to account for groups but with a multilevel regression we will need fewer parameters for the same.
Group effects: Often we are specifically interested in group effects such as the role of schools in determining test outcomes of students. This can not be attained by regular regressions so we use multilevel models.
The Tech Platform


Comments