
INTRODUCTION TO COMPLEX NETWORK ANALYSIS
- The Tech Platform

- Feb 27, 2021
- 4 min read

Complex Network Analysis studies how to recognise, describe, visualise and analyse complex networks. The most prominent way of analysing networks is using Python Library NetworkX which provides a prominent way for constructing and drawing complex Neural Networks.
The prominent reason for the explosion of CNA research and applications is due to two factors - one is the availability of cheap and powerful computers that enables researchers and scientists with advanced training in mathematics, physics and social sciences to perform top notch researches and the other factor is the ever increasing complexity of social, behavioural, biological , financial and technological aspects of humanity.
Network is a relational form of organisation and representation of discrete data. The two most important concepts concerning networks are entities and the relationships between them. Entities are referred to as nodes and relationships are known as edges. Network nodes and edges are high level abstractions and for most networks their true nature is not essential. When it is essential, we represent nodes and edges by adding properties also known as attributes. A relationship or edge typically involves two discrete entities or nodes although an entity can be in a relationship with itself, such a relationship is referred to as reflexive.


NODES AND EDGES SHOWING DIRECTED AND UNDIRECTED RELATIONSHIPS
Before moving to what a complex network really looks like, let’s talk about the basic simple network sometimes called a Classic Network. An example of a classic network is a linear network — timeline of our life, each life event (such as “birth”, “first time walking”, “school graduation”, “marriage” and eventually “death” ) is an entity with at least one attribute which is time. “Happening after” is the relationship in this scenario as an edge connects two events together with one event happening immediately after the other. The reason why this network is considered simple is because it has a regular structure and not because it is small.


LINEAR TIMELINE OF LIFE
A complex Network has a non-trivial structure, it’s neither a grid nor a tree. These complex networks happen in nature and the man-made world as a result of decentralised processes with no global control. Some of the representatives of this class of network include:
Social networks: Families and Friends, Twitter and instagram followers etc..
Cultural networks: Religion networks, Language families etc..
Technological networks: transportation and communication systems etc…
Financial networks: Financial networks, wall street market, international trade etc..
Biological networks: gene/protein interactions, disease epidemics etc..

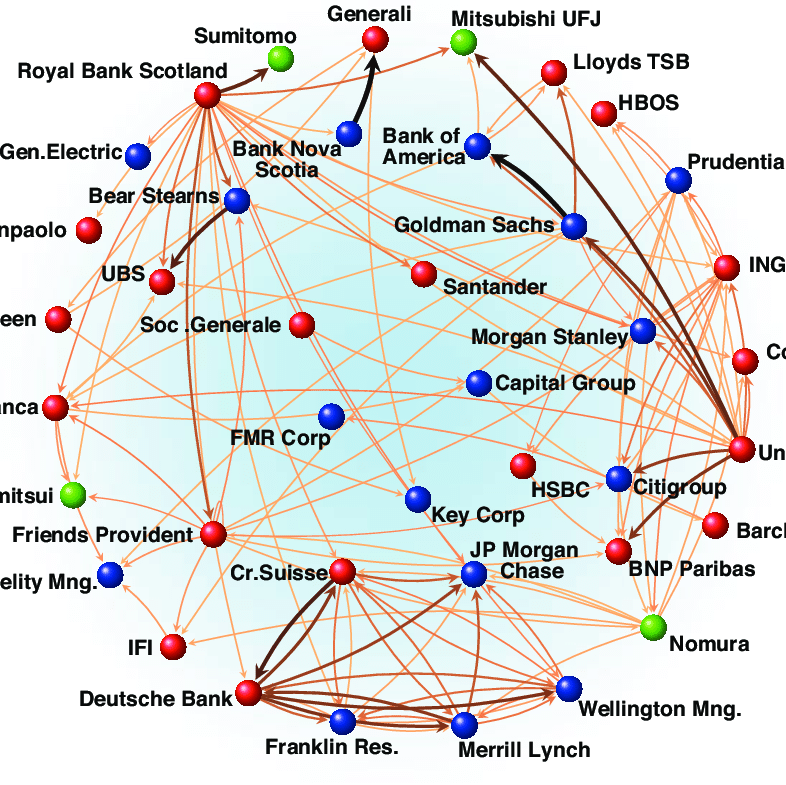
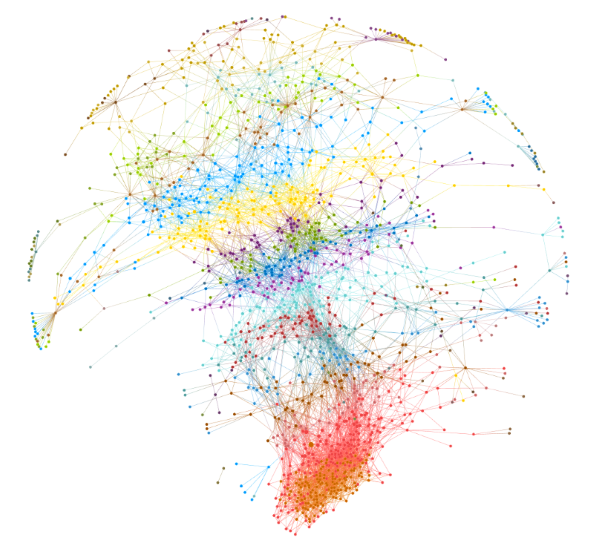
AN EXAMPLE OF A FINANCIAL NETWORK
Complex Network Analysis is the study of complex networks — their structure, properties and dynamics. The most common python tools for manipulating and processing networks are NetworkX, iGraph, graph-tool and networkit but my most preferred is NetworkX. Some of the reasons why I prefer NetworkX includes the ease of installation since it’s written in pure python and can be imported as a library using : import networkx as nx
NetworkX also has excellent online documentation and active community of supporters on Stackoverflow and it’s performance is acceptable up to 100,000 nodes.
PYTHON NETWORKX
Complex Network Analysis is an iterative process , whereby the network grows, shrinks or undergoes certain transformations over time. Any network starts with one node and we can always add more nodes and edges to it as needed. The attributes of the nodes and the edges describe their properties and these come from any sort of data you might have such as Social network data, fraudulent users data, biological and disease epidemic data among others. A networkx network is a collection of edges and labeled nodes and to create a new network graph, you must choose an appropriate graph type and call the respective constructor; pass either no parameters (for an empty graph) or a list of edges as node pairs (lists or tuples).
NetworkX supports four graph types namely:
1. Undirected graphs: They consist of only undirected edges — these are edges that can be traversed in either direction so that an edge from node A to node B is the same as an edge from node B to node A. Undirected graphs also represent symmetric relationships, just to say if A is in a relationship with B, B is also in a relationship with A.
G = nx.Graph()2. Directed Graphs: They are also known as a digraphs, have at least one directed edge. “Being the mother of” is a symmetric relationship and would be represented by a directed edge. Twitter and Instagram also use this relationship as you can follow someone but not necessarily being followed back by the person on the social media platforms.
G = nx.DiGraph()You can convert a digraph into an undirected graph. All directed edges become undirected, and all pairs of two reciprocal edges become single edges. However, remember that the original digraph and the derived undirected graph are different.
F = nx.Graph(G) #F is undirected3. Multigraphs: These are like undirected graphs, but they can have parallel edges — multiple edges between the same nodes. The Parallel edges may represent different types of relationships between the nodes. For example James may be a brother to John, but also maybe his classmate. Create an empty multigraph with the constructor:
G = nx.MultiGraph()4. Directed Multigraphs: These are just directed graphs with parallel edges and you can create an empty directed multigraph with the constructor:
G = nx.MultiDiGraph()So far so good, we have covered the basic concepts of network analysis such as simple networks and complex networks. Which library to use for complex network analysis such as NetworkX. Also the various graph types available, which scenario requires the use of each and how to create empty graphs with the constructor.
Source: Medium
The Tech Platform


Comments