Use Wikipedia As A Data Source To Prepare Power BI Report
- Dhruvin Shah

- Mar 19, 2019
- 2 min read
Overview
Power BI is a business intelligence tool that supports so many data sources to prepare a report. As we all know, Wikipedia is a very good resource of useful information, and we can consume Wikipedia data as a data source and prepare a Power BI report.
Example
In this example, we will prepare a report of the largest selling pharma products. We will use the following URL as a Data Source -
https://en.wikipedia.org/wiki/List_of_largest_selling_pharmaceutical_products
If we open the above link, it will show the analytical data for selling a pharma product.
Note - Make sure of one thing - If we want to use Wikipedia as a data source, its information must be stored in a tabular manner. Only then can we consume its data in Power BI.
Now, let’s get stated!
Step 1
Open Power BI Desktop and click on Get Data.
Step 2
Select Other Services > Web as a data source. Then, click "Connect".
Step 3
It will ask you to enter the URL. Post the URL as following-
https://en.wikipedia.org/wiki/List_of_largest_selling_pharmaceutical_products
Step 4
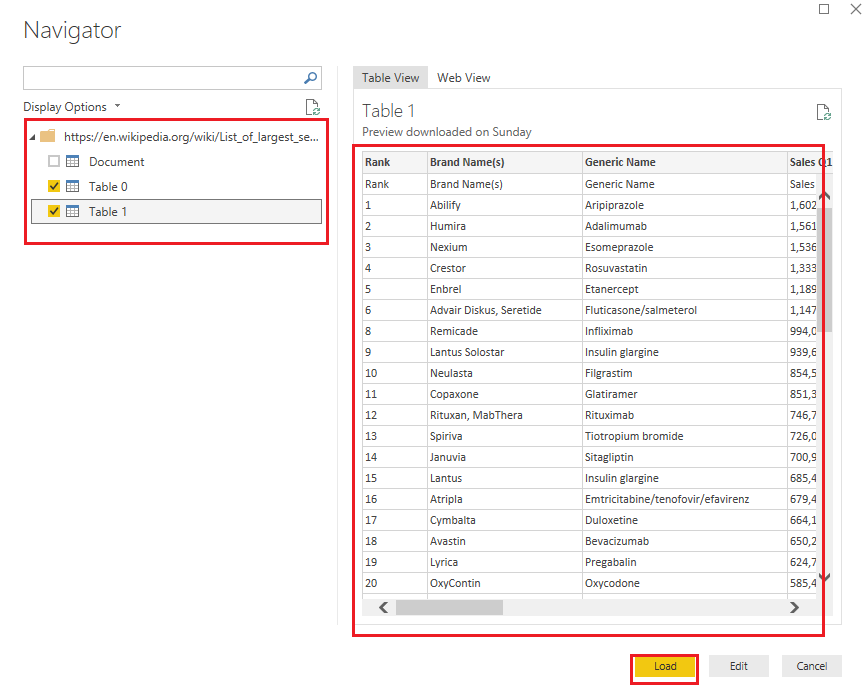
It will show all available tables from Wikipedia. We will select both the tables. Now, click "Load".
Step 5
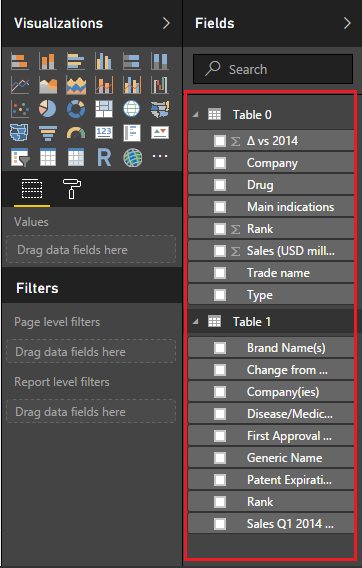
The below screen shows two tables loaded in Power BI.
Step 6
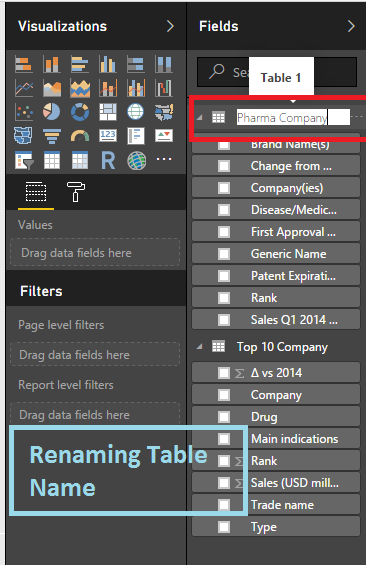
Now, we will rename our tables. Double click the name of an old table and rename it. We will rename our tables as “Top 10 Company” and “Pharma Company” respectively.
We will also rename one column as "Sales" by clicking on it.
Step 7
We can also check if our data is loaded properly or not using Data tab on the left side.
The below screenshot shows the data from both the tables.
Step 8
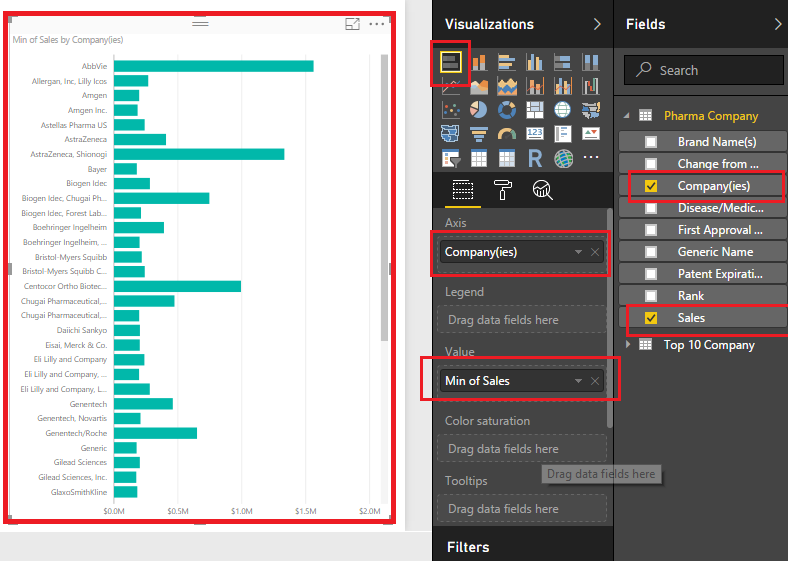
Now, it’s time to add visuals. We will add one “Table" visual and one “Staked bar chart” visual.
Properties for both the visuals are in below screenshot.
Table Visual
This visual shows the following columns.
o Brand o Company o Rank o Sales
Staked bar chart visual
This visual shows the sales report data with respect to the company name.
Step 9
Now, we will apply some formatting on our visuals so as to make them more attractive.
I have formatted the visuals. Below is a screenshot of both the visuals after formatting.
Step 10
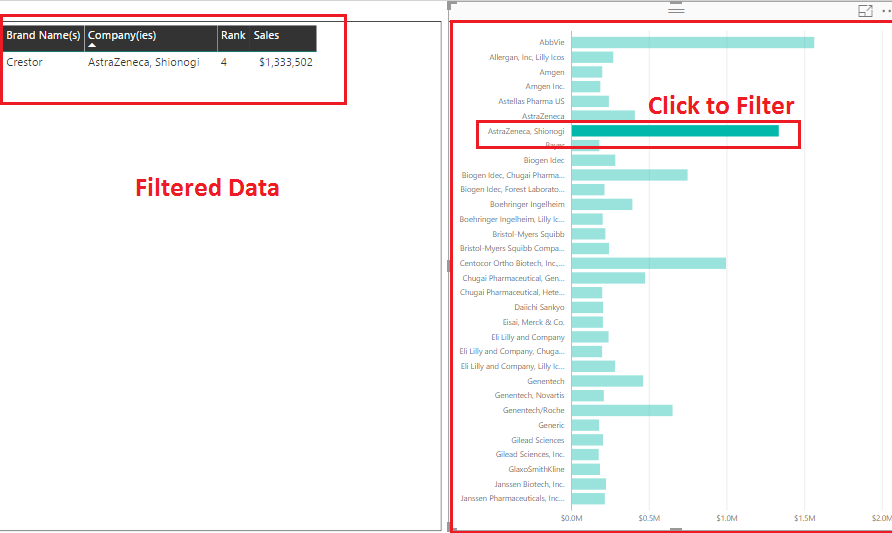
Now, let's filter our report based on the company name. From bar chart, click on any company.
It will filter the data based on company name in a table.
Conclusion
This is how we can prepare a Power BI Report consuming Wikipedia as a Data Source.
I hope you love this article.

















Comments