
Create Pictograph in Excel
- The Tech Platform

- Nov 5, 2022
- 2 min read
A Pictograph is a chart that shows pictures representing data and is set up like a bar chart. In this article, we will learn how to create a Pictograph in Excel.
What is Pictograph?
A pictograph also known as a pictogram depicts the frequency of data in the form of pictures or symbols. Each image or symbol may illustrate one or more units of the data. It is often more difficult to visualize data precisely with a pictograph. This is why pictographs should be used carefully to avoid misrepresenting data either accidentally or deliberately.
How Pictograph in different from Bar Chart?
Pictographs and Bar charts are similar. Both are used to show the data. The only difference is:
Pictograph uses images to display information.
A bar Chart uses numbers to display information.
Steps to Create Pictograph in Excel
STEP 1: Create a Table.

STEP 2: Select the Table and go to insert.
STEP 3: Now, select the 2-D Bar chart. (See the below image)

STEP 4: After selecting the 2-D bar chart, you will get the bar chart the same as the below image.

STEP 5: Right-click on the chart and select "Format Data Series".

STEP 6: Now see the right pane. Go to paint and select "Picture or texture fill".
STEP 7: You will get the texture in the bar graph.

STEP 8: To get the image in the bar graph, click "Insert".
STEP 9: Click on Online Picture and select the image which you want to insert.
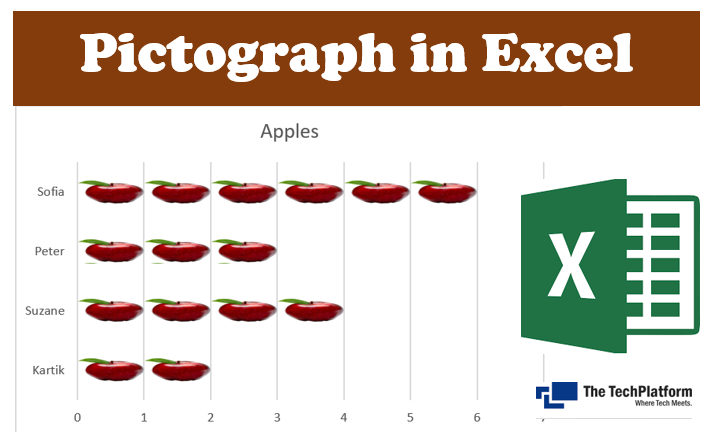
For example, I have to display the data for the Apples, so I have inserted the apple image.

STEP 8: Now, select "Stock and Scale with".

STEP 9: See the below image, your information will be displayed like this.

Advantages of Pictograph
A pictograph is simple and easy to analyze.
In a pictograph objects or symbols represents numbers, which is more interesting and easier to understand.
Disadvantages of Pictograph
A pictograph is not very useful for larger data when numbers are in hundreds or thousands or more.
A pictograph can be used only for data given in whole numbers.
When data are given in large numbers, parts of a symbol does not use for data or it is not applicable to represent a large number of data.
Sofia Sondh
The Tech Platform


Comments