
Add Star Rating In Power BI Desktop Using DAX Expression
- Dhruvin Shah

- Mar 23, 2019
- 1 min read
Overview
In this article, we will learn how we can add Star Ratings in Power BI desktop using a DAX Expression.
I have attached a sample practice file with this article.
Scenario
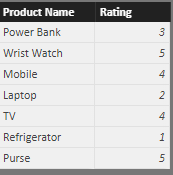
I have one Product table having two columns:
Product Name
Rating
Now, I want to represent ratings in the form of Stars.
Let’s get started.
Step 1
Create a new measure column in Power BI Desktop.
Step 2
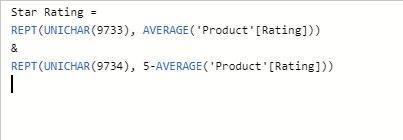
Add the following DAX expression.
Star Rating =
REPT(UNICHAR(9733), AVERAGE('Product'[Rating]))
&
REPT(UNICHAR(9734), 5-AVERAGE('Product'[Rating]))
Now, let’s elaborate on what this DAX expression means.
Here, I have used two DAX functions to achieve this requirement.
UNICHAR()
REPT()
UNICHAR( )
This function returns the Unicode character that is referenced by a given numeric value.
Syntax
UNICHAR(Number)
Example
Suppose I write UNICHAR(65) then it will return ‘A’ because ASCII value of A is 65.
In our case for filled stars, we have used UNICHAR(9733) which will return a filled star.
UNICHAR(9734) will return a hollow star without filling.
We have concatenated both the stars using logic.
REPT( )
This function repeats text a given number of times. Use REPT to fill a cell with a number of instances of a text string.
Syntax
REPT(Text, NumberOfTimes) Suppose my rating is 4 then I need to repeat stars four times. So, I will use:
REPT(UNICHAR(9733), AVERAGE('Product'[Rating])) The above statement will repeat Filled stars four times.
Now, I want to show a rating out of five. So, one star will be unfilled. So, I have used the following: REPT(UNICHAR(9734), 5-AVERAGE('Product'[Rating]))
Step 3
Now let’s drag the fields to a table.
It will look like this.

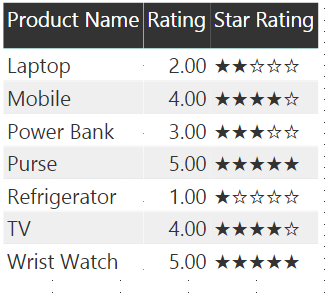
Conclusion
This is how we can apply Star Rating using DAX expressions.


Comments