
What Is an SVG File? SVG Image and Tags Explained
- The Tech Platform

- Dec 20, 2020
- 4 min read


SVG
SVG or Scalable Vector Graphics is a web standard for defining vector-based graphics in web pages. Based on XML the SVG standard provides markup to describe paths, shapes, and text within a viewport. The markup can be embedded directly into HTML for display or saved to a .svg file and inserted like any other image.
You can write SVG by hand, but more complicated graphics can be designed in vector graphics editors such as Illustrator or InkScape and exported to SVG files or code.
SVG Basics
Developers start an SVG graphic with the <svg> tag and XML namespace like so:
<svg xmlns="http://www.w3.org/2000/svg" version="1.1"></svg>The sample also includes a version attribute. The version attribute is optional but it is recommended for complaince with XML specifications.
This sample won’t display anything, it merely established a viewport. You can add height and width attributes to set a display size for the viewport this essentially establishes a canvas for you to work in.
With a viewport in place you can add basic graphics, text, and path elements.
<svgversion="1.1"width="100%"viewbox="0 0 600 300"xmlns="http://www.w3.org/2000/svg">
<rect x="10" y="10" width="100" height="100" fill="#f7b2c1" />
<circle cx="240" cy="60" r="50" fill="#c1b2f7" stroke="#b2c1f7" stroke-width="15"/>
<text x="450" y="70" font-size="20" text-anchor="middle">
SVG Text is browser readable!</text><g stroke="#b2c1f7">
<!-- g is for group -->
<path stroke-width="2" d="M10 170 l590 0" />
<path stroke-width="4" d="M10 190 l590 0" />
<path stroke-width="6" d="M10 210 l590 0" />
</g>
</svg>
You can see the output and play with the code in this codepen.
In the opening svg tag we add a width attribute to set the width of the viewport to 100% of the container width, you can use percentages or pixel widths. The opening svg tag also has viewbox attribute which defines a window through which elements of your svg are visible, in this case, the viewbox spans from (0,0) to (600,300). In SVG space the X-axis starts with zero on the left and increases to the right; the Y-axis starts with zero at the top and increases towards the bottom.
The first new tag is the <rect /> tag which defines a rectangle in the SVG viewport. In this case we define a square which is 10 units from the top and left and 100 units tall and wide. The fill attribute sets the fill color for the shape.
Next we define a circle or oval with the <circle /> tag. The sample defines a circle centered at (240,60) with a radius of 50 units. The stroke and stroke-width attributes set a stroke color and a size for the stroke.
You can add text to the graphic with the text tag. The sample text is anchored from the middle of the text to a point at (450, 70) and has a font size of 20 units. The nice thing about text in SVG is it will scale with the rest of your graphic, but it is still readable by the browser and web bots.
When you want to apply the same attributes or CSS styles to multiple SVG elements you can group them with the <g> tag. Attributes assigned to the <g> tag, like the stroke attribute in the example, will be applied to all elements within the group. In this case three <path /> elements.
The <path /> element defines a vector path in the viewport. The path is defined by the d attribute. In the first example the definition reads ‘move to the absolute coordinate (10, 170) and draw a line to the relative coordinates 590 in the X direction and 0 in the Y direction.
The following commands can be used to create your path:
M = move to L = line to H = horizontal line to V = vertical line to Z = close path C = (cubic bezier) curve to S = smooth curve to Q = quadratic bezier curve to T = smooth quadratic bezier curve to A = arc
The canvas element
Canvas graphics can be drawn onto a
A context is created through the getContext method on the
<p> Before canvas</p >
<canvas width ="120" height ="60"> </canvas>
<p >After canvas</p>
<script>
    var canvas = document.querySelector("canvas");
    var context = canvas.getContext("2d");
    context.fillStyle = "red";
    context.fillRect (10, 10, 100, 50);
</script>
After creating the context object, the example draws a red rectangle 100 pixels wide and 50 pixels high, with its top-left corner at coordinates (10,10).
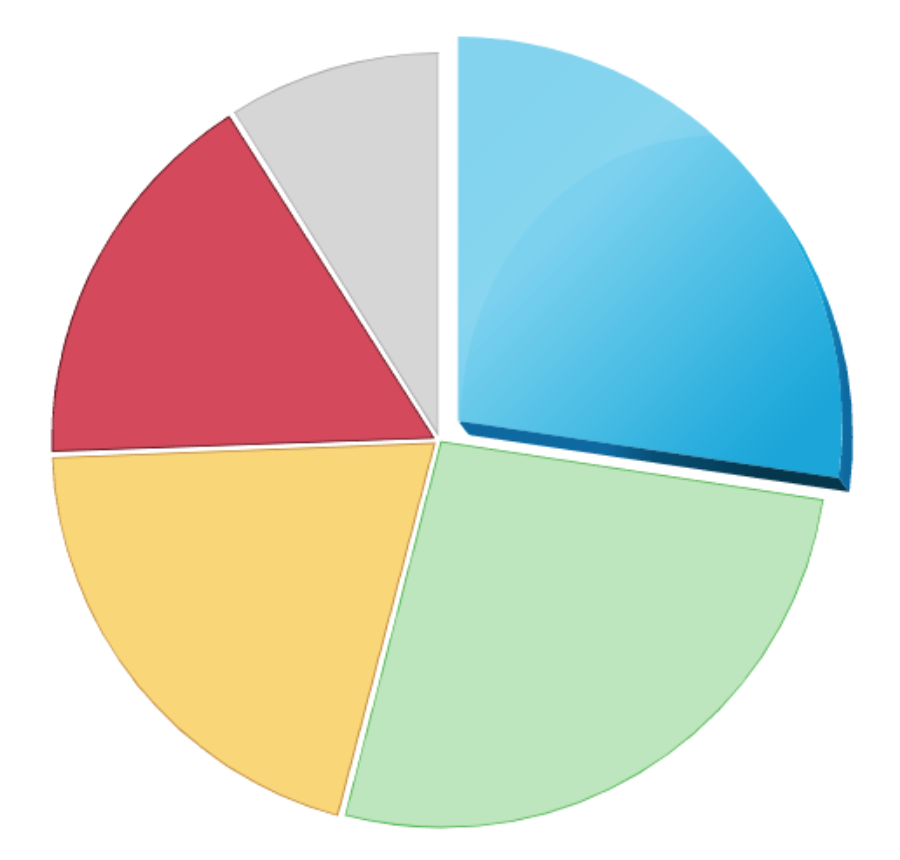
Drawing a pie chart
The results variable contains an array of objects that represent the survey responses.
var results = [
{ name : "Satisfied", count: 1043, color: "lightblue"} ,
{ name : Neutral", count: 563 , color: "lightgreen"} ,
{ name : Unsatisfied", count: 510 , color: "pink"} ,
{ name : "No comment", count: 175 , color: "silver"}
];
To draw a pie chart, we draw a number of pie slices, each made up of an arc and a pair of lines to the center of that arc. We can compute the angle taken up by each arc by dividing a full circle (2 π ) by the total number of responses and then multiplying that number (the angle per response) by the number of people who picked a given choice.
<canvas width ="200" height ="200"></canvas>
<script>
    var cx = document.querySelector("canvas").getContext("2d");
    var total = results.reduce(function (sum, choice) {
    return sum + choice.count;
    }, 0);

    // Start at the top

    var currentAngle = -0.5 * Math.PI;
    results.forEach (function (result) {
    var sliceAngle = (result.count / total) * 2 * Math.PI;
    cx.beginPath() ;
    // center = 100, 100, radius = 100
    // from current angle, clockwise by slice's angle
    cx.arc(100, 100, 100, currentAngle, currentAngle + sliceAngle);
    currentAngle += sliceAngle;
    cx.lineTo(100, 100);
    cx.fillStyle = result.color ;
    cx.fill() ;
    });
</script>
This draws the following chart:

Browser Support
Browser support for SVG is available in all modern browsers. There are some issues with scaling in IE 9 through IE 11 however they can be overcome with the use of the width, height, viewbox, and CSS.
Editors
Vectr - web and desktop tool fot creating and editing SVG graphics, free of charge
Tools to create SVG
There are few tools available to create SVG in the form of drawing program.
Inkscape - It is an open source tool for state-of-the-art vector drawing with an easy to use graphical interface.
Adobe Illustrator - Adobe Illustrator is a commercial tool for Vector Imagery.
Why you should use SVGs
As a vector image format, it allows you to resize an image without any loss of quality and a particularly light weight. As an XML format, it allows you to benefit from the full power of JavaScript and especially CSS.
Source: freecodecamp


Comments