
Quickstart: Query data in Azure Data Explorer Web UI
- The Tech Platform

- Sep 12, 2020
- 4 min read
Azure Data Explorer is a fast and highly scalable data exploration service for log and telemetry data. Azure Data Explorer provides a web application that enables you to run and share queries. The application is available in the Azure portal and as a stand-alone web application. In this article, you work in the stand-alone version, which enables you to connect to multiple clusters and to share deep links to your queries.
If you don't have an Azure subscription, create a free Azure account before you begin.
Prerequisites
In addition to an Azure subscription, you need a test cluster and database to complete this quickstart.
Sign in to the application
Sign in to the application.
Add clusters
When you first open the application, there are no connections.


You must add a connection to at least one cluster before you can start running queries. In this section, you add connections to the Azure Data Explorer help cluster that we have set up to aid learning, and to the test cluster you created in a previous quickstart.
In the upper-left of the application, select Add cluster.
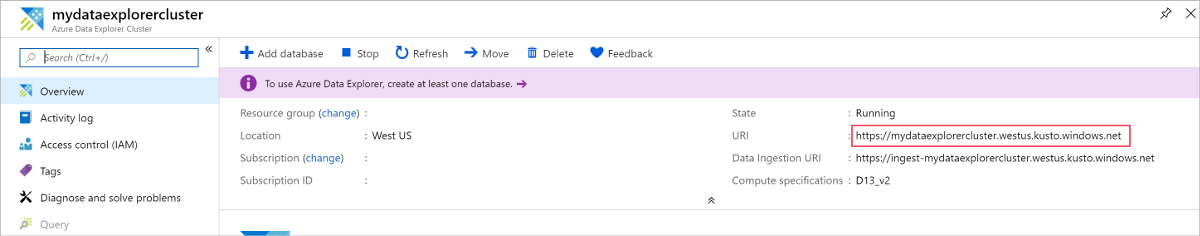
In the Add cluster dialog box, enter the URI, then select Add. You may use the help cluster URI, https://help.kusto.windows.net. If you have your own cluster, provide the URI of your cluster. For example, https://mydataexplorercluster.westus.kusto.windows.net as in the following image:

In the left pane, you should now see the help cluster. Expand the Samples database so that you can see the sample tables that you have access to.
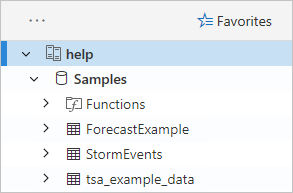
We use the StormEvents table later in this quickstart, and in other Azure Data Explorer articles.
Now add the test cluster you created.
Select Add cluster.
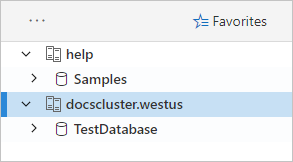
In the Add cluster dialog box, enter your test cluster URL in the form https://<ClusterName>.<Region>.kusto.windows.net/, then select Add. In the example below, you see the help cluster and a new cluster, docscluster.westus (full URL is https://docscluster.westus.kusto.windows.net/).
Run queries
You can now run queries against either cluster that you're connected to (assuming you have data in your test cluster). We'll focus on the help cluster.
In the left pane, under the help cluster, select the Samples database.
Copy and paste the following query into the query window. At the top of the window, select Run.
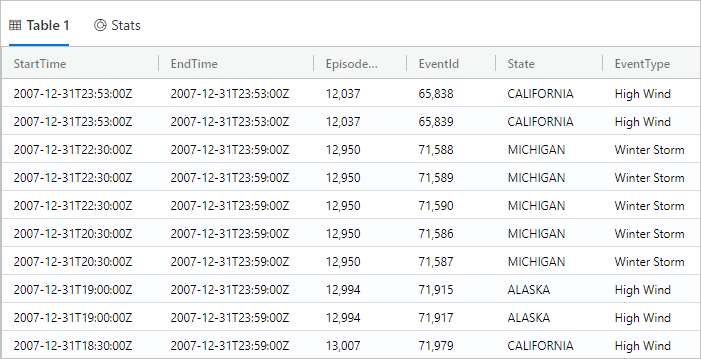
StormEvents | sort by StartTime desc | take 10 This query returns the ten newest records in the StormEvents table. The left side of the result should look like the following table.

The following image shows the state that the application should now be in, with clusters added, and a query with results.


Copy and paste the following query into the query window, below the first query. Notice how it's not formatted on separate lines like the first query.
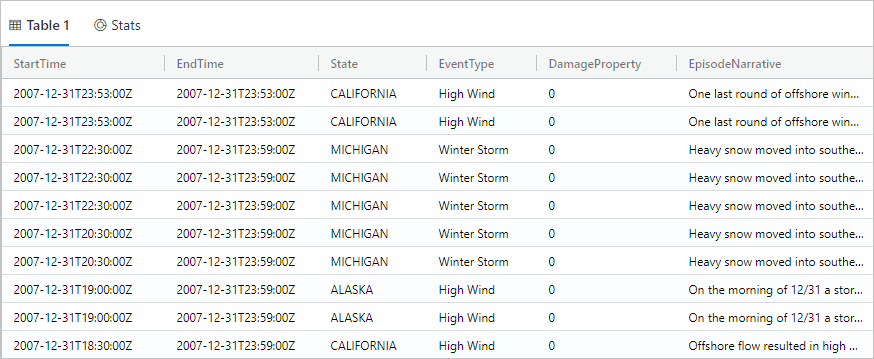
StormEvents | sort by StartTime desc | project StartTime, EndTime, State, EventType, DamageProperty, EpisodeNarrative | take 10 Click the new query in the window, which selects the query. Press Shift+Alt+F to format the query, so it looks like the following.
Press Shift+Enter, which is a shortcut to run a query. This query returns the same records as the first one, but includes only the columns specified in the project statement. The result should look like the following table.

At the top of the query window, select Recall. The query window now shows the result set from the first query without having to rerun the query. Often during analysis, you run multiple queries, and Recall enables you to revisit the results of previous queries.
Let's run one more query to see a different type of output.
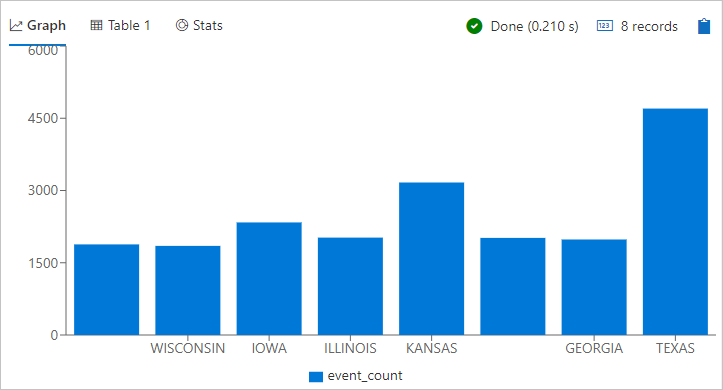
StormEvents | summarize event_count=count(), mid = avg(BeginLat) by State | sort by mid | where event_count > 1800 | project State, event_count | render columnchart
The result should look like the following chart.

Note
Blank lines in the query expression can affect which part of the query is executed. If no text selected, it's assumed that the query or command is separated by empty lines. If text is selected, the selected text is run.
Work with the table grid
Now you've seen how basic queries work, let's look at how you can use the table grid to customize results and do further analysis.
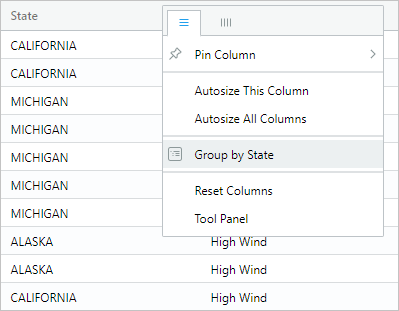
Rerun the first query. Mouse-over the State column, select the menu, and select Group by State.

In the grid, expand California to see records for that state.
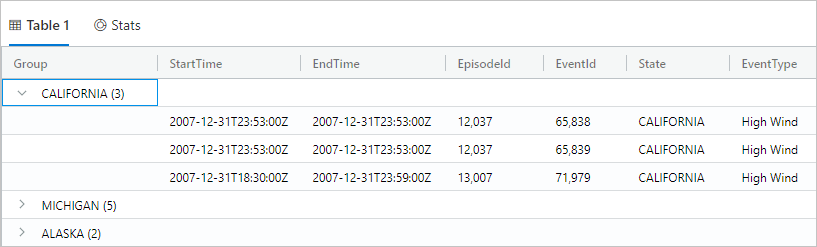
This type of grouping can be helpful when doing exploratory analysis.
Mouse-over the Group column, then select Reset columns.

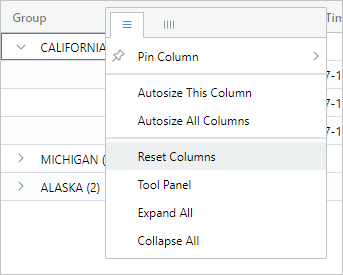
This returns the grid to its original state.
Run the following query.
StormEvents | sort by StartTime desc | where DamageProperty > 5000 | project StartTime, State, EventType, DamageProperty, Source | take 10 On the right side of the grid, select Columns to see the tool panel.

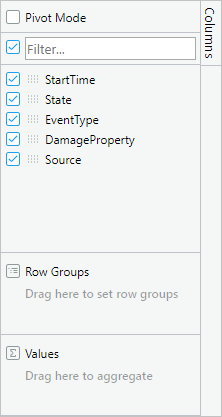
This panel functions similarly to the pivot table field list in Excel, enabling you to do more analysis in the grid itself.
Select Pivot Mode, then drag columns as follows: State to Row groups; DamageProperty to Values; and EventType to Column labels.

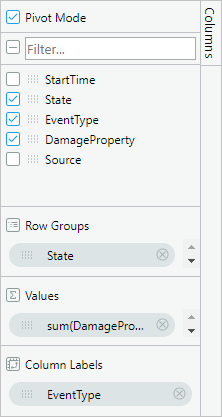
The result should look like the following pivot table.


Notice how Vermont and Alabama each have two events under the same category, while Texas has two events under different categories. Pivot tables enable you to quickly spot things like this; they are a great tool for quick analysis.
Share queries
Many times, you want to share the queries you create.
In the query window, select the first query you copied in.
At the top of the query window, select Share.


The following options are available in the drop-down:
Link to clipboard
Link query to clipboard
Link, query, results to clipboard
Pin to dashboard
Query to Power BI
Provide a deep link
You can provide a deep link so that other users with access to the cluster can run the queries.
In Share, select Link, query to clipboard.
Copy the link and query to a text file.
Paste the link into a new browser window. The result should look like the following after the query runs.
Pin to dashboard
When you complete data exploration using queries in the Web UI and find the data you need, you can pin it to a dashboard for continuous monitoring.
To pin a query:
In Share, select Pin to dashboard.
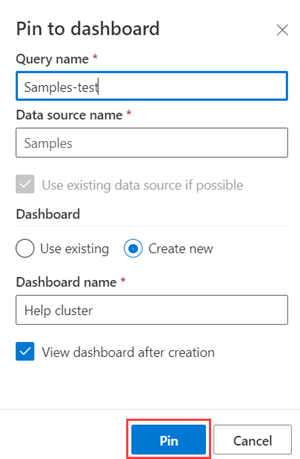
In the Pin to dashboard pane:
Provide a Query name.
Select Use existing or Create new.
Provide Dashboard name
Select the View dashboard after creation checkbox (if it's a new dashboard).
Select Pin

Note
Pin to dashboard only pins the selected query. To create the dashboard data source and translate render commands to a visual in the dashboard, the relevant database must be selected in the database list.
Export query results
To export the query results to a CSV file, select File > Export to CSV.


Provide feedback
In the upper-right of the application, select the feedback icon .
Enter your feedback, then select Submit.
Clean up resources
You didn't create any resources in this quickstart, but if you'd like to remove one or both clusters from the application, right-click the cluster and select Remove connection.
Source: Microsoft


Comments