
Measuring Code Quality With Visual Studio
- The Tech Platform

- Sep 9, 2020
- 4 min read
If we Google – “how to write good code”, we end up getting tons of articles. Over 90% of them talk about thousands of guidelines, which are never easy to follow and sometimes confusing. Most of the articles don’t talk about the measurement of code quality. Whatever we have read in our Computer Science curriculum has taken a back seat, but relax, Visual Studio has taken very good care of this and provides the complete measurement of needed parameters for our code, project, and solutions. Many developers are not familiar with this, so I thought of writing about this as a refresher for everyone. I follow SOUND for my code and code review, but still, that is not about code quality measurement.
How to run code analysis
For this, you don’t need to do anything additional, no new extension installation. It comes by default with Visual Studio and you can access it from the Analyze tab.
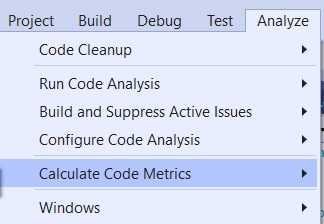
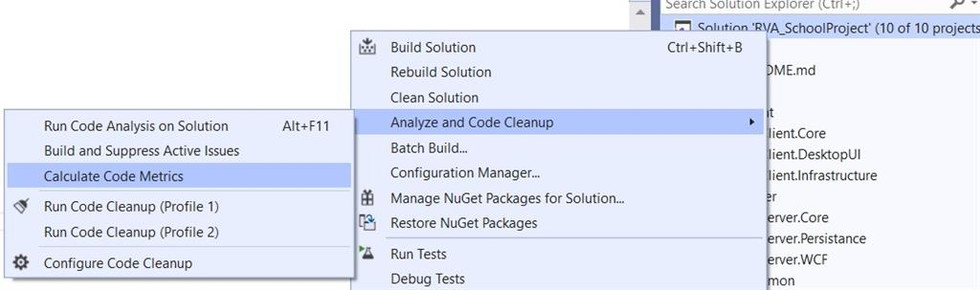
Code Metrics come from Analyze tab and another from solution explorer.

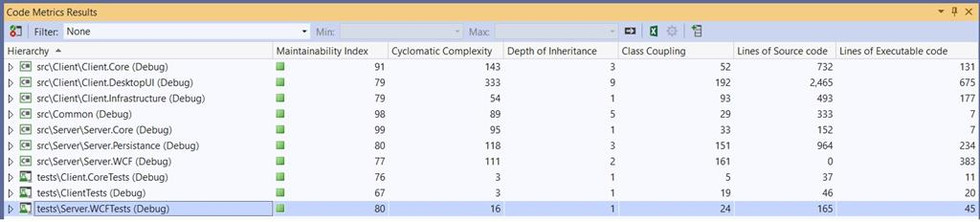
And we get this window with all the needed parameters and values,
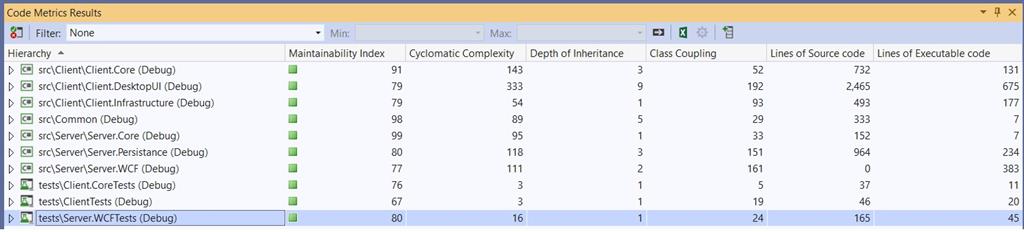
So we saw these parameters and their values; now let us try to understand each of them in detail. For this article, I have used Visual Studio 2019.
Cyclomatic Complexity
Cyclomatic complexity is a software metric used to indicate the complexity of a program. It is a quantitative measure of the number of linear independent paths through a program’s source code.
- Wikipedia
Cyclomatic Complexity is calculated using the control flow diagram. It uses the following formula,
Cyclomatic Complexity (CYC) = E – N + 2
Where E and N are the number of edges and nodes, respectively in the control flow diagram for a particular program.
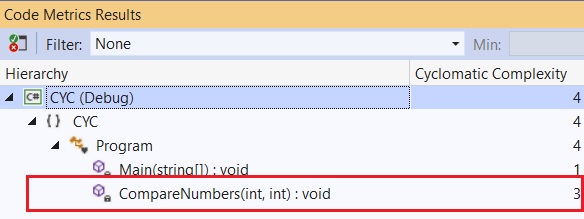
If it is not clear to you, no worries, this simple example of comparing two numbers will explain this,


But if you are thinking this is the simplest program and, in your assignments, you get a complex program and it will be impossible to make an equivalent control flow diagram for everything you code, you are absolutely right. Visual Studio calculates this for you and here is the output for the same example,
Important Points
A lower number of CYC is recommended for any method. There is no strict guideline but based on different blogs and software scientists' opinions, CYC can have these ranges –
CYC < 10, is considered to be easy to understand.
CYC between the range of 10-20 is complex but still comprehensive.
CYC greater than 20 is considered very complex.
CYC greater than 30 should be split into smaller methods.
The number of test cases for any method id directly proportional to Cyclomatic Complexity.
With this explanation, I hope you understand the Cyclomatic Complexity now, which was the intention of this article.
Maintainability Index
This uses a complex formula and as per MSDN,
Maintainability Index = MAX(0,(171 – 5.2 * ln(Halstead Volume) – 0.23 * (Cyclomatic Complexity) – 16.2 * ln(Lines of Code))*100 / 171)
If you don’t understand this formula, don’t worry. What we need to infer from here, I will explain in a few points,
Its value ranges from 0 to 100.
The higher the value of the Maintainability index, the more maintainable the code is.
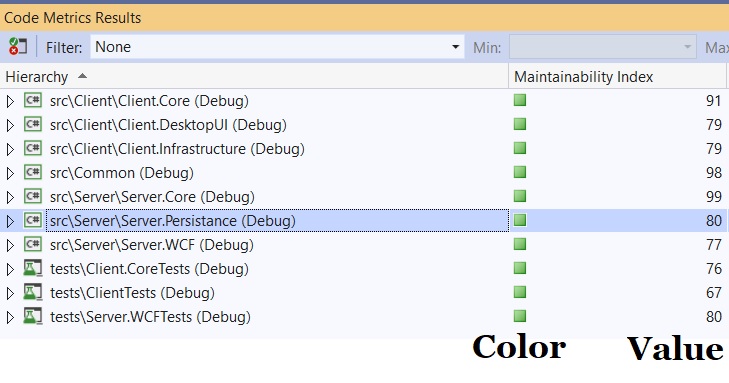
The range for them in Visual Studio is defined as follows.
Important Points
0-9 = Red
10-19 = Yellow
20-100 = Green
And this is how you see them in your code,

Depth of Inheritance
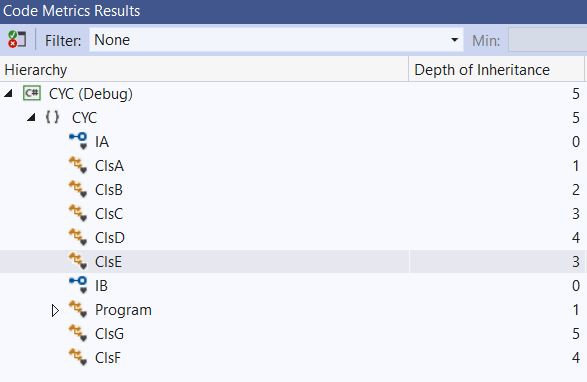
It shows the number of inherited classes, all the way from the base class. It doesn’t count the implemented interface. This diagram explains the complete story in detail,


And you see the same result for code analysis,

Important Points
The lower the number, the more understandable, and easier to maintain.
A higher number of DIT means a higher level of inheritance and in turn more breaking changes.
DIT > 7, should be avoided and classes should be redesigned, if possible.
Class Coupling
It is also known as Coupling Between Objects (CBO) which means it measures the coupling and by principle, we know that coupling should be minimum and cohesion should be high.

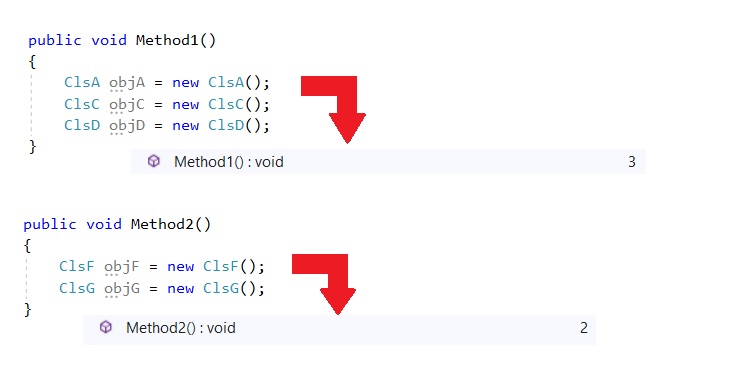
Here I have taken the previous example.
Important Points
CBO only counts the number of unique objects referenced or directly instantiated in the method.
Method2 has the object of class G, which has the highest DIT but still, it has CBO or class coupling as 2.
As per MSDN – CBO has an optimal limit of 9, more than that could be very problematic.
Lines of source code
This is a very popular and commonly used metric. For measuring LOC we can have Physical Lines of code, Logical lines of code, and Comments line of code.
It will be clear from these two illustrations,
Example # 1
for(i=;i<100;i++)printf("hello");/* How many lines of code is this? */ Example # 2
/* Now how many lines of code is this? */
for(i=;i<100;i++)
{
   printf("hello");
} 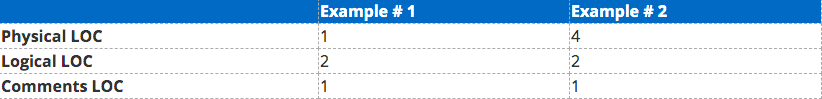
Understanding Lines of Code
No need to take these numbers as Visual Studio again takes good care of it and it counts Physical + Comments line of code for this metric.
Important Points
It is the count of blank lines and comments. Lower LOC is recommended.
Sometimes you can’t control the number of lines in a method and class but try to keep this as low as you can.
Lines of Executable Code
This metric counts the lines of code in generated MSIL code, you don’t have control over this. This is how it looks like in the analysis tool,

Again, the lower value of this is recommended.
I hope this article helps you get a good understanding of various parameters of measuring your code quality and you will run this tool more frequently and restructure before it is too late.
Source: React Virtual Conference


Comments