A look inside one of the most powerful tools of the tech trade
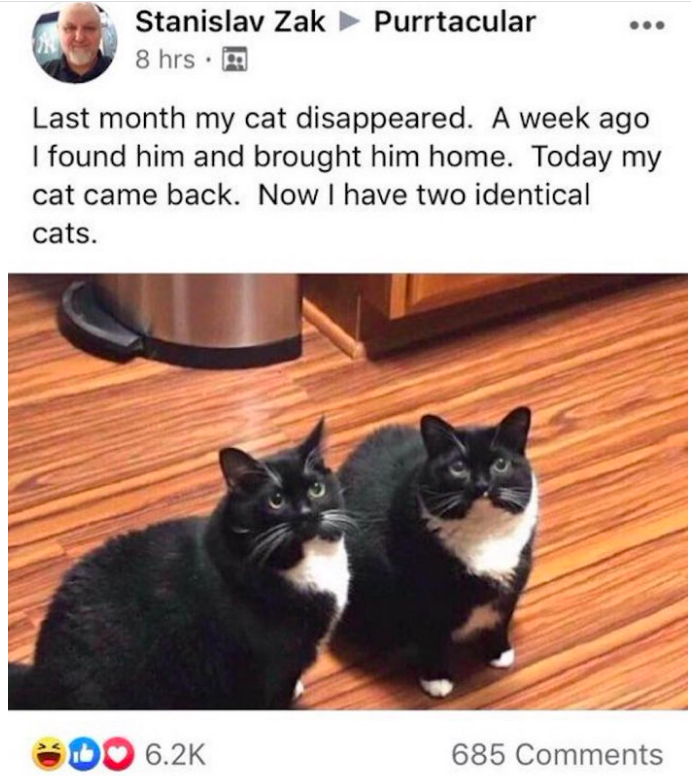
In a nutshell: A/B testing is all about studying causality by creating believable clones — two identical items (or, more typically, two statistically identical groups) — and then seeing the effects of treating them differently.
When I say two identical items, I mean even more identical than this. The key is to find “believable clones” … or let randomization plus large sample sizes create them for you.
Scientific, controlled experiments are incredible tools; they give you permission to talk about what causes what. Without them, all you have is correlation, which is often unhelpful for decision-making.
Experiments are your license to use the word “because” in polite conversation.
Unfortunately, it’s fairly common to see folks deluding themselves about the quality of their inferences, claiming the benefits of scientific experimentation without having done a proper experiment. When there’s uncertainty, what you’re doing doesn’t count as an experiment unless all three of these components are present:
Different treatments applied
Treatments randomly assigned
Scientific hypothesis tested (see my explanation here)
If you need a refresher on this topic and the logic around it, check out my article Are you guilty of using the word “experiment” incorrectly?
Why do experiments work?
To understand why experiments work as tools for making inferences about cause-and-effect, take a look at the logic behind one of the simplest experiments you can do: the A/B test.
Short explanation
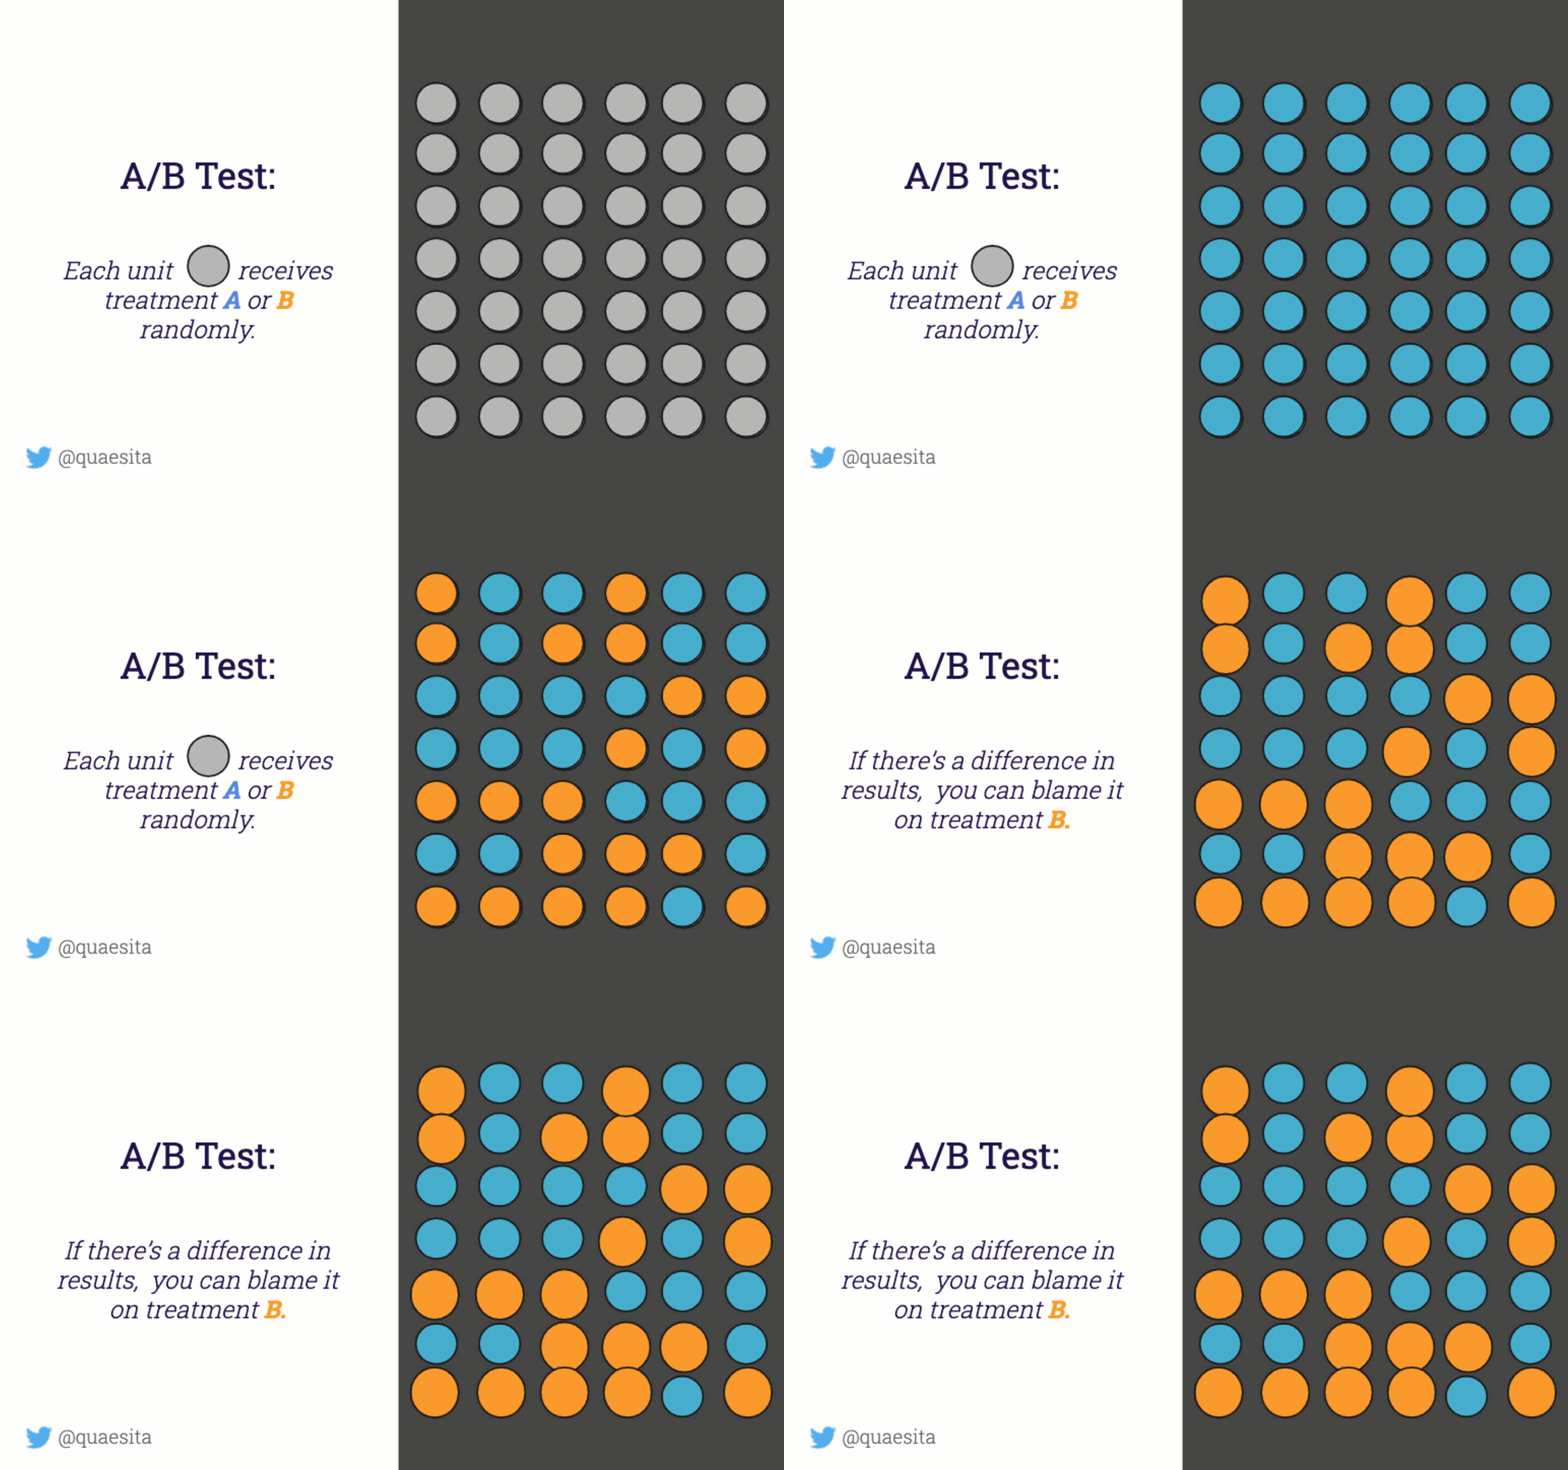
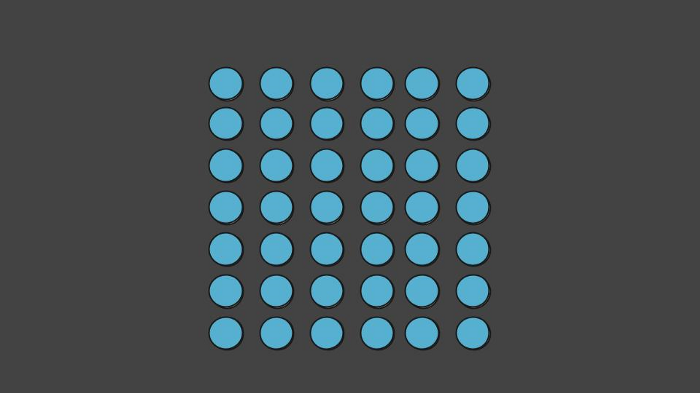
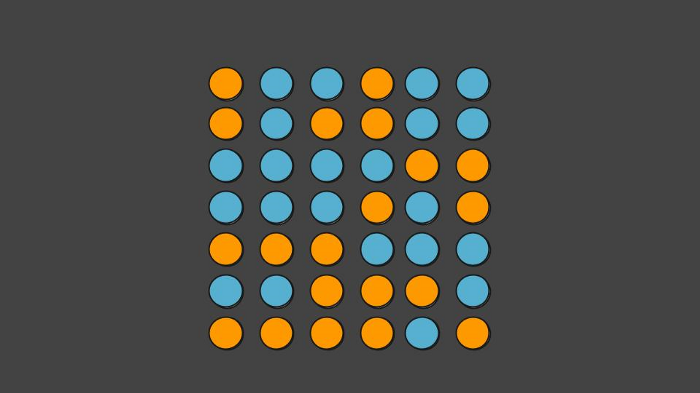
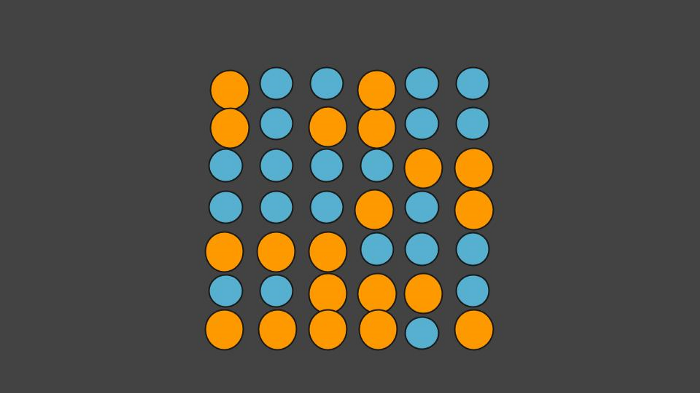
If you don’t feel like reading a detailed example, take a look at this GIF and then skip to the final section (“The secret sauce is randomization”):
Long explanation
If you prefer a thorough example, I’ve got you covered.
Imagine that your company has had a grey logo for a few years. Now that all your competitors have grey logos too (imitation is the sincerest form of flattery), your execs insist on rebranding to a brighter color… but which one?
The logo your users see is grey, but that’s about to change.
After a careful assessment of what’s practical given your company’s website color scheme, your design team identifies the only two feasible candidates: blue and orange.
The CEO’s favorite color is blue, so she picks approving blue as the default action. In other words, she’s saying that if there’s no further information, she’s happy to err on the side of blue. Luckily for you, she’s a strong data-driven leader who is willing to allow data to change her mind to orange.
In order to switch to the alternative action of approving an orange logo, the CEO requires evidence that an orange logo causes your current user population to click more (relative to blue) on specific parts of your website.
You’re the senior data scientist at your company, so your ears prick up. You immediately identify that your CEO’s approach to decision-making fits the framework from frequentist statistics. After listening to her carefully, you confirm that her null and alternative hypotheses have to do with matters of cause-and-effect. That means you need to do an experiment! Summarizing what she tells you:
Default action: Approve blue logo. Alternative action: Approve orange logo. Null hypothesis: Orange logo does not cause at least 10% more clicking than blue logo. Alternative hypothesis: Orange logo does cause at least 10% more clicking than blue logo.
Why 10%? That’s the minimum effect size your CEO was willing to accept. If a decision-maker cares about effect sizes, those should be baked into the hypothesis test up front. Testing a null hypothesis of “no difference” is an explicit statement that you don’t give a damn about effect sizes.
For a setup like this one, an A/B test is the perfect experimental design. (For other cause-and-effect decisions, you may need other designs. Though I’ll only cover A/B testing here, the logic behind the more complicated designs is similar.)
So, let’s do an A/B test!
Live traffic experimentation
There are all kinds of ways to run A/B tests. What you see in psychology labs (and focus group studies) tends to involve inviting people off the street, showing different stimuli to different folks at random, then asking them questions. Alas, your CEO is looking for something more difficult. Her question can only be answered with a live traffic experiment, which is exactly what it sounds like: you’ll be serving different versions of your logo live to different users as they go about their usual business on your website.
Experiment infrastructure
If you want to run a live traffic experiment, you’ll need some special infrastructure in place. Work with your engineers to build the ability to serve different treatments to different users at random as well as the ability to track your CEO’s desired metrics (click-through rate on certain website elements) by treatment condition.
(In case you’re wondering why everyone doesn’t do live traffic experiments all the time, the answer usually has to do with the high up-front costs of rejiggering a production system that wasn’t built with experimentation in mind. While companies like Google build experimentation infrastructure into most of our systems before we even know what experiments we’ll want to run, traditional organizations may forget to add this feature at the outset and can find themselves behind their more tech-savvy competitors as a result. As a side note, if you’re tempted to get into the applied ML/AI game, experimental infrastructure is a must-have.)
Sample
Because you’re properly cautious you’re not going to surprise all your users with a sudden new logo. The much smarter thing to do is to sample a subset of your users for your experiment, then do a gradual rollout (with the option for a rollback to grey if your changes create an unforeseen disaster).
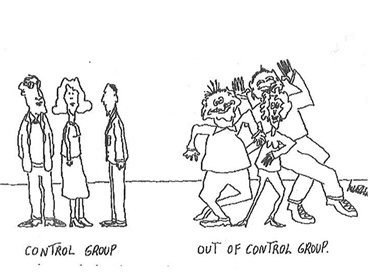
Control
If you were interested in seeing how users respond to novelty — do they click more because the logo changed, regardless of what it changed to? — you’d use the grey logo treatment as your control group. However, that’s not the question your CEO wants answered. She is interested in isolating the causal influence of orange relative to blue, so given the way she’s framing her decision, the control group should be users who are shown the blue logo.
First, your system tentatively applies the blue logo baseline to all the users in your sample.
But before the system actually shows them the blue logo, the experimentation infrastructure flips a virtual coin to randomly reassign some users to the orange treatment and show them orange instead of blue.
Then — at random — you show the orange version to some users but not others.
If you then observe a higher average click-through rate on the orange version, you will be able to say that it is the orange treatment that is responsible for the difference in behavior. If that difference is statistically higher than 10%, your CEO will happily switch to orange as she promised. If not, she’ll go with blue.
If users in the orange treatment condition respond differently from the control condition, you can say that showing the orange version *causes* more clicks than the blue version.
The secret sauce is randomization
If you had not done this at random, if you’d given the orange treatment to — for example — all your logged-in users while showing the blue treatment to everyone else, you cannot say that it is the orange treatment that’s responsible for the difference. Maybe your logged-in users are simply more loyal to your company and like your products more, no matter what color you make your logo. Maybe your logged-in users have a higher propensity to click no matter what color you show them.
Randomization is key. It’s the secret sauce that allows you to make conclusions about cause and effect.
That’s why that randomness piece is so important. With large sample sizes (experiments don’t work without lots of statistical power), random selection creates groups whose differences come out in the wash. Statistically speaking, the two groups are believable clones of one another.
The more straightforward your decision criteria and the larger your sample sizes, the less complicated your experimental designs need to be. A/B tests are great, but more fancy-pants experimental designs allow you to control for some confounding factors explicitly (e.g. a 2x2 design where you separate the logged-in users from not-logged-in users and run mini A/B tests within each group to let randomness take care of the rest for you). This is especially useful when you have a strong hunch that orange logos affect logged-in users differently and you want to incorporate that into your decision-making. Either way, random selection is a must!
Thanks to random selection, the groups of users in the A/B test’s blue and orange conditions will be similar (in aggregate) in all ways folks traditionally think about cherry-picking participants to balance their studies: similar representation of genders, races, ages, education levels, political views, religions… but they’ll also be similar in all the ways you probably didn’t think to control: similar representation of cat-lovers, tea-drinkers, gamers, goths, golfers, ukulele owners, generous givers, good swimmers, people who secretly hate their spouses, people who haven’t showered for a few days, people who are allergic to oranges without realizing it, and so on.
When you use randomization to create two large groups, you’ve got a statistical blank canvas.
That’s the beauty of large sample sizes combined with random selection. You don’t have to rely on your cleverness in thinking up the right confounding factors to control for. When you use randomization to create two large groups, you’ve got a statistical blank canvas — your two groups are statistically identical in every way except one: what you’re about to do to them.
Your two groups are statistically identical in every way except one: what you’re about to do to them.
If you observe a substantial difference between the results of the two groups, you will be able to say that the difference in what happens was due to what you did. You can say that it was caused by your treatment. That’s the amazing power of (proper) experiments!
If we did a real experiment and find a significant difference in the group results, we can blame that on what we did!
After having a good laugh, the first thing the internet did with these cats is played a very nit-picky game of “Spot The Difference.” That’s what scientists would do too, if you presented two shoddy “clones” and attempted to blame different results on different treatments. Without large sample sizes, how do you know it’s *not* that little spot under the nose that’s responsible for whatever results you may observe?
Source: paper.li


