
Async vs Sync Benchmark (.NET)
- The Tech Platform

- Feb 17, 2021
- 4 min read
One of my favorite interview questions is “What do such words as async and await tell you?”, because it opens up an opportunity to have an interesting discussion with an interviewee… Or it doesn’t because they float in this topic. In my opinion it is drastically important to understand why we use this technique. I have a feeling that many developers prefer to rely just on “it is the best practice” and blindly use asynchronous methods.
This article shows the difference between asynchronous and synchronous methods in practice.
Tools
.NET 5 Web Api application (test target)
Azure Sql Database
Azure App Service (hosts the application)
Azure App Insights (to gather metrics)
locust framework (to simulate user load).
Configuration

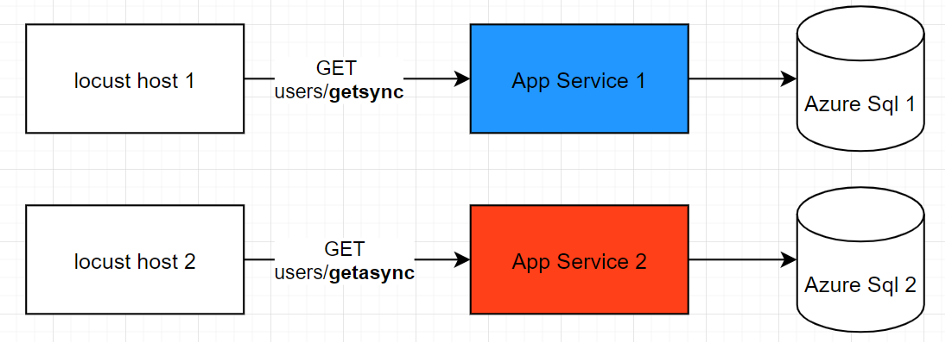
Experiment schema
I will run a benchmark in the following way. There are two independent locust instances running on two machines*. Locust instances simulate a user that does the following:
a user from the locust host 1 hits the synchronous endpoint of the App Service 1, gets the response, stays idle during 0.5–1 seconds (the exact time delay is random). Repeats till the end of the experiment
a user from the locust host 2 behaves exactly the same, with the only one difference — he hits the asynchronous endpoint of the App Service 2.
Under the hood each App Service connects to its own database and executes a SELECT query that takes five seconds and returns a few rows of data. See the controller’s code below for references. I’ll use dapper to make a call to the database. I’d like to draw your attention to the fact that the asynchronous endpoint calls the database asynchronously as well (QueryAsync<T>).


App Services code
Worth adding that I deploy the same code to both app services.
During the test the number of users grows evenly up to the target number (Number of Users). The speed of growth is controlled by a Spawn Rate parameter (number of unique users to join per second) — the higher the number is, the quicker the users are being added. Spawn rate is set to 10 users/s for all experiments.
All experiments are limited to 15 minutes.
You may find machines configuration details in the Technical details section of the article.
Metrics
requests per minute — shows a number of requests that the application actually processed and returned a status code
thread count — shows the number of threads the app service consumes
median response time, ms
The red lines refer to asynchronous, the blue lines — to the synchronous endpoint respectively. That’s it about theory, let’s start.
Experiment #1
number of users: 75 (per service)
We can see that both endpoints perform similarly — being able to handle around 750 requests per minute with a median response time of 5200 ms.


Experiment #1. Requests per minute
The most fascinating graph in this experiment is a thread trend. You can see significantly higher numbers for the synchronous endpoint (a blue graph) — more than 100 threads!


Experiment #1. Thread count
That’s expected though and matches the theory — when a request comes in and the application makes a call to the database the thread is being blocked because it has to wait for a roundtrip to complete.
Therefore when another request comes in the application has to produce a new thread to handle it.
The red graph — the asynchronous endpoint thread count— proves different behavior. When a request comes in and the application makes a call to the database then the thread returns to a thread pool instead of being blocked. Therefore when another request comes in this free thread is being reused. Despite incoming requests keep growing the application doesn’t require any new threads, so their count remains the same.
Worth to mention the 3rd metric — median response time. Both endpoints showed the same result — 5200 ms. So there is no difference in terms of performance.

Experiment #1. Summary
Now it is time to pull up stakes.
Experiment #2
number of users: 150
We doubled the load. The asynchronous endpoint handles this task successfully — its request per minute rate floats around 1500. The synchronous brother eventually reached the comparable number of 1410. But if you look at the graph below you will see that it took 10 minutes!
The reason for that is that the synchronous endpoint reacts on a new user arrival by creating another thread, but users are being added to the system (just to remind that the Spawn Rate is 10 users/s) quicker than the web server can adapt to. That’s why it queued so many requests at the very beginning.


Experiment #2. Requests per minute
It is not a surprise that the thread count metric is still around 34 for the asynchronous endpoint while it increased from 102 to 155 for the synchronous one. The median response time degraded similarly to the request per minute rate — the synchronous response time was much higher at the beginning of the experiment. If I kept the test for 24 hours the median numbers would become even.

Experiment #2. Summary
Experiment #3
number of users: 200
The third experiment is intended to prove trends revealed during the second one —we can see further degradation of the synchronous endpoint.

Experiment #3. Summary
Conclusion
The use of asynchronous operations instead of synchronous doesn’t help to improve performance or user experience directly. First of all, it improves stability and predictability under pressure. In other words, it picks up the load threshold, so the system can process more before it starts degrading.
Appendix #1. Technical details
Azure App Service: B1, 100 ACU, 1,75 Gb Memory, A-Series compute equivalent
Azure Sql Database: Standard S4: 200 DTUs, 500 Mb storage
Sql Connection settings: Max Pool Size=200
Appendix #2. Notes
*In order to achieve the cleanest test result I should have run tests from 2 VMs located in the same network where the target App Services sit. But I assumed that a network lag would impact both app in a similar way, therefore it cannot jeopardize the main goal — compare how asynchronous and synchronous methods behave.
Appendix #3. Bonus Experiment
What did I hack in order to force synchronous endpoint to perform almost as asynchronous and plot the graph below (experiment conditions are the same as in the third one — 200 users)?


Bonus Experiment. Requests per minute
Source: Medium
The Tech Platform


Comments