Turn Photos into Cartoons Using Python
- The Tech Platform

- Jan 9, 2021
- 3 min read
You can give a cartoon effect to a photo by implementing machine learning algorithms in Python.
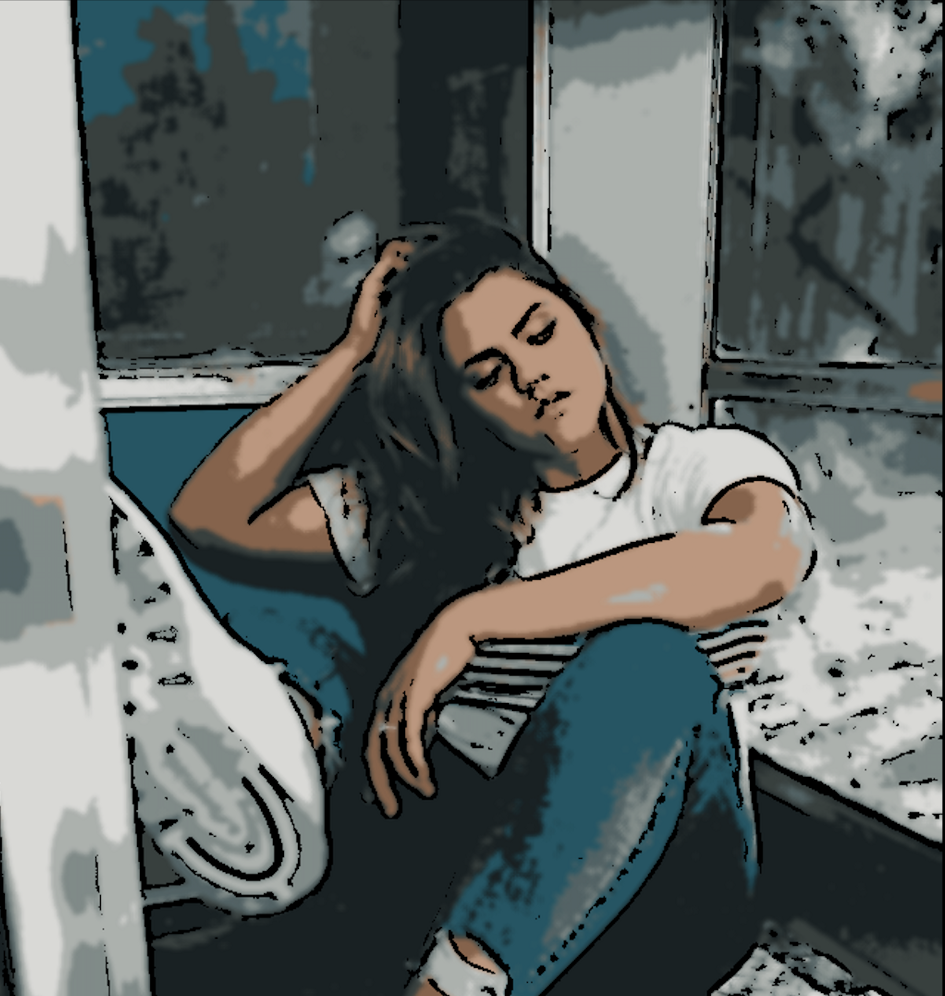
Original Image by Kate Winegeart on Unsplash, Edited by Author
As you might know, sketching or creating a cartoon doesn’t always need to be done manually. Nowadays, many apps can turn your photos into cartoons. But what if I tell you, that you can create your own effect with few lines of code?
There is a library called OpenCV which provides a common infrastructure for computer vision applications and has optimized-machine-learning algorithms. It can be used to recognize objects, detect, and produce high-resolution images.
In this tutorial, I will show you how to give a cartoon-effect to an image in Python by utilizing OpenCV. I used Google Colab to write and run the code.
To create a cartoon effect, we need to pay attention to two things; edge and color palette. Those are what make the differences between a photo and a cartoon. To adjust that two main components, there are four main steps that we will go through:
Load image
Create edge mask
Reduce the color palette
Combine edge mask with the colored image
Before jumping to the main steps, don’t forget to import the required libraries in your notebook, especially cv2 and NumPy.
import cv2
import numpy as np

# required if you use Google Colab
from google.colab.patches import cv2_imshow
from google.colab import files
1. Load Image
The first main step is loading the image. Define the read_file function, which includes the cv2_imshow to load our selected image in Google Colab.
def read_file(filename):
    img=cv2.imread(filename)
    cv2_imshow(img)
    return img
Call the created function to load the image.
uploaded = files.upload()
filename = next(iter(uploaded))
img = read_file(filename)
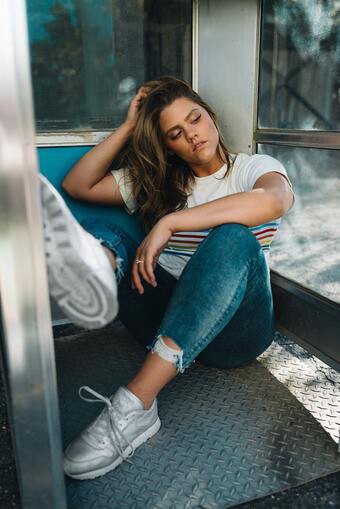
I chose the image below to be transformed into a cartoon.
Image by Kate Winegeart on Unsplash
2. Create Edge Mask
Commonly, a cartoon effect emphasizes the thickness of the edge in an image. We can detect the edge in an image by using the cv2.adaptiveThreshold() function.
Overall, we can define the egde_mask function as:
def edge_mask(img, line_size, blur_value):
    gray=cv2.cvtColor(img, cv2.COLOR_BGR2GRAY)
    gray_blur=cv2.medianBlur(gray, blur_value)
    edges=cv2.adaptiveThreshold(gray_blur, 255, cv2.ADAPTIVE_THRESH_MEAN_C, cv2.THRESH_BINARY, line_size, blur_value)
    return edges
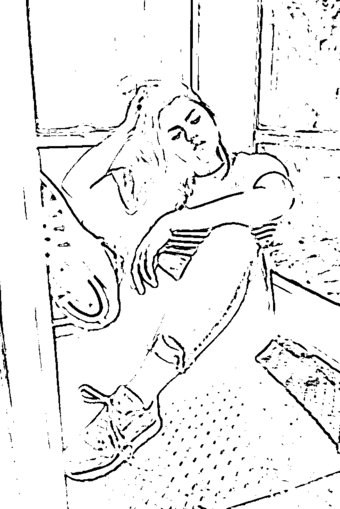
In that function, we transform the image into grayscale. Then, we reduce the noise of the blurred grayscale image by using cv2.medianBlur. The larger blur value means fewer black noises appear in the image. And then, apply adaptiveThreshold function, and define the line size of the edge. A larger line size means the thicker edges that will be emphasized in the image.
After defining the function, call it and see the result.
line_size = 7
blur_value = 7

edges = edge_mask(img, line_size, blur_value)
cv2_imshow(edges)
Edge Mask Detection
3. Reduce the Color Palette
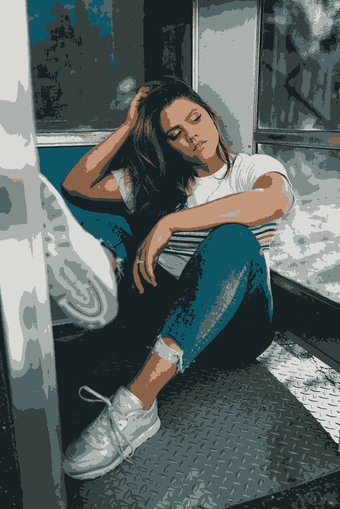
The main difference between a photo and a drawing — in terms of color — is the number of distinct colors in each of them. A drawing has fewer colors than a photo. Therefore, we use color quantization to reduce the number of colors in the photo.
Color Quantization
To do color quantization, we apply the K-Means clustering algorithm which is provided by the OpenCV library. To make it easier in the next steps, we can define the color_quantization function as below.
def color_quantization(img, k):
# Transform the image
    data=np.float32(img).reshape((-1, 3))

# Determine criteria
criteria= (cv2.TERM_CRITERIA_EPS+cv2.TERM_CRITERIA_MAX_ITER, 20, 0.001)

# Implementing K-Means
    ret, label, center=cv2.kmeans(data, k, None, criteria, 10, cv2.KMEANS_RANDOM_CENTERS)
    center=np.uint8(center)
    result=center[label.flatten()]
    result=result.reshape(img.shape)
    return result
We can adjust the k value to determine the number of colors that we want to apply to the image.
total_color = 9
img = color_quantization(img, total_color)
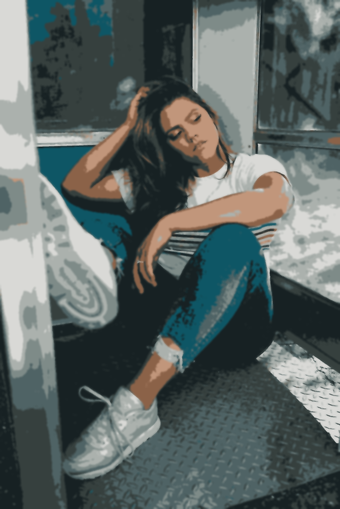
In this case, I used 9 as the k value for the image. The result is shown below.
After Color Quantization
Bilateral Filter
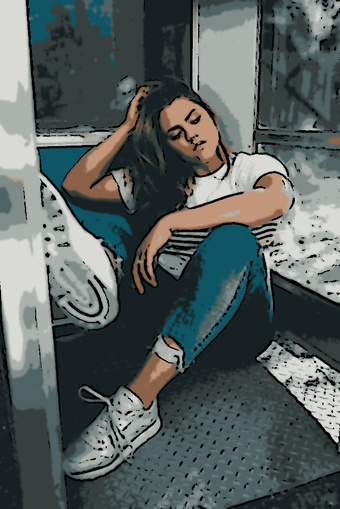
After doing color quantization, we can reduce the noise in the image by using a bilateral filter. It would give a bit blurred and sharpness-reducing effect to the image.
blurred = cv2.bilateralFilter(img, d=7, sigmaColor=200,sigmaSpace=200)There are three parameters that you can adjust based on your preferences:
d — Diameter of each pixel neighborhood
sigmaColor — A larger value of the parameter means larger areas of semi-equal color.
sigmaSpace –A larger value of the parameter means that farther pixels will influence each other as long as their colors are close enough.
Result of Bilateral Filter
4. Combine Edge Mask with the Colored Image
The final step is combining the edge mask that we created earlier, with the color-processed image. To do so, use the cv2.bitwise_and function.
cartoon = cv2.bitwise_and(blurred, blurred, mask=edges)And there it is! We can see the “cartoon-version” of the original photo below.
Final Result
Now you can start playing around with the codes to create your own version of the cartoon effect. Besides adjusting the value in parameters that we used above, you can also add another function from OpenCV to give special effects to your photos. There’s still a lot of things in the library that we can explore.
Source: medium.com
The Tech platform









Comments