REST API in SharePoint 2010 for Excel Services: Part 2
- Vijai Anand Ramalingam

- Apr 10, 2019
- 1 min read
In this article we will be seeing how to access the Charts and PivotTable using REST URL and how to add the chart to the SharePoint Wiki page. Here is Part 1
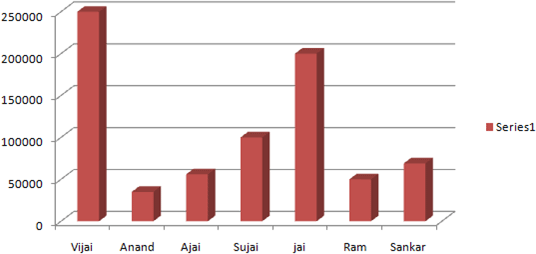
Chart in the excel workbook:
Charts:
In this section we will be seeing how to access the charts using the REST URL.
REST URL:
http://serverName:1111/sites/VJTesting/_vti_bin/excelrest.aspx/Shared%20Documents/ExcelChart.xlsx/model/Charts
REST aspx Page URI - http://servername:1111/sites/VJTesting/_vti_bin/excelrest.aspx
Workbook Location - /Shared%20Documents/ExcelChart.xlsx
Resource Location- /model/Charts
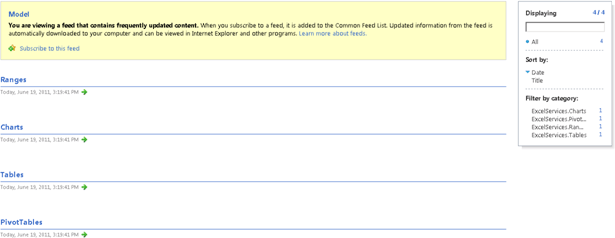
This will show all the charts available as shown in the following
http://ctsinmbpmoss:1111/sites/VJTesting/_vti_bin/excelrest.aspx/Shared%20Documents/ExcelChart.xlsx/model/Charts('Chart%201')
Add the Chart to the SharePoint Wiki Page:
Open the SharePoint Wiki Page.
Go to Site Actions => Edit the Page.
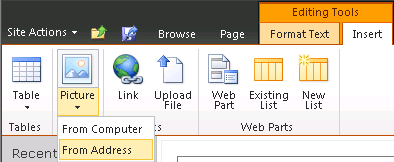
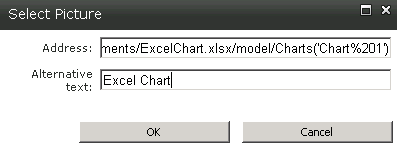
In the ribbon interface, go to Editing Tools => Insert => Picture => From Address.
Enter the Chart REST URL and alternate text.
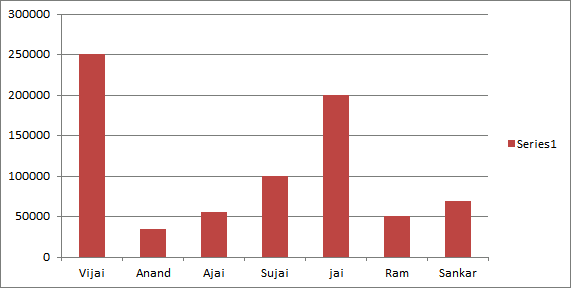
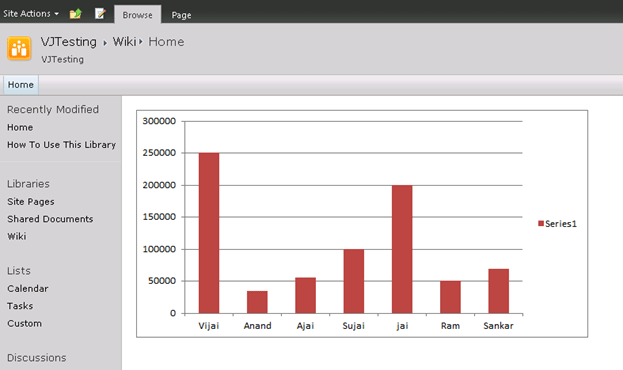
The chart looks like the following.
Any changes made to the chart in the excel workbook will be reflected in the Wiki page also (where we have added the chart).
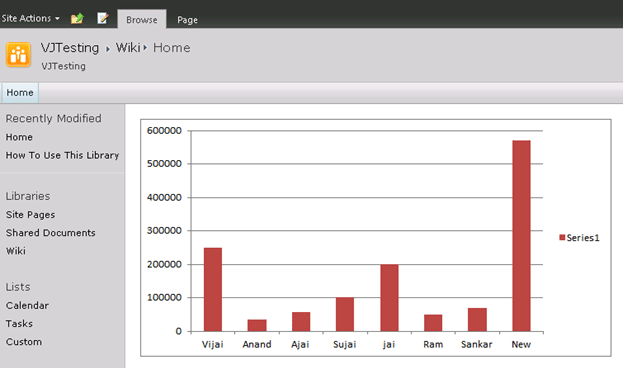
I have added a new item "New" in the chart and it will be reflected in the wiki page chart also as shown in the following.
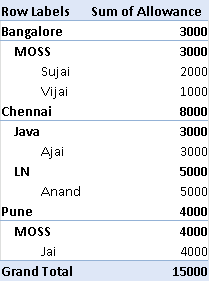
Pivot table in the excel workbook:
Pivot Tables:
In this section we will be seeing how to access the pivot tables using the REST URL.
REST URL:
http://serverName:1111/sites/VJTesting/_vti_bin/excelrest.aspx/Shared%20Documents/ExcelChart.xlsx/model/ PivotTables
REST aspx Page URI - http://servername:1111/sites/VJTesting/_vti_bin/excelrest.aspx
Workbook Location - /Shared%20Documents/ExcelChart.xlsx
Resource Location- /model /PivotTables
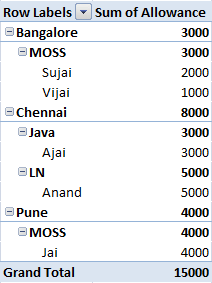
This will show all the pivot tables available as shown in the following
http://ctsinmbpmoss:1111/sites/VJTesting/_vti_bin/excelrest.aspx/Shared%20Documents/ExcelChart.xlsx/model/PivotTables('PivotTable2')
The output looks like the following




Comments