
Plotly In Python
- The Tech Platform

- Oct 27, 2020
- 8 min read
Updated: Jan 19, 2024
Plotly in Python is a powerful plotting library that supports diverse chart types for creating interactive visualizations. Built on plotly.js, it seamlessly integrates with Python, enabling users to produce captivating plots for various domains. The library is open-source, allowing users to create interactive web-based visualizations. This article explores the installation process, optional dependencies, and integration with Dash, showcasing the versatility of Plotly in Python for data visualization.
Table of Contents:
Offline capabilities of plotly.py
What is Plotly in Python?
Plotly is a versatile Python library for creating interactive and visually appealing visualizations. It supports over 40 unique chart types, ranging from simple line charts to complex 3D plots and geographic maps. Built on top of the Plotly JavaScript library (plotly.js), Plotly in Python, often referred to as "plotly.py," provides a seamless experience for users aiming to generate interactive web-based plots directly within their Python environment.
Importance of interactive and web-based visualizations
Interactive and web-based visualizations offer significant advantages in data exploration and communication. They assign users to dynamically explore datasets, zoom in on specific data points, and gain insights in real time.
Web-based visualizations also facilitate collaboration by allowing users to share and interact with plots through web applications, dashboards, or other online platforms.
Integration with Dash for building analytical applications
Plotly's integration with Dash extends its capabilities by enabling the creation of analytical applications. Dash is an open-source Python framework designed for building web applications with a focus on analytical and data-driven functionalities.
By combining Plotly's interactive plots with Dash's web application framework, users can develop powerful and customizable applications for data analysis, visualization, and exploration.
Installation and setup
To install Plotly, users can use either pip or conda. The following commands demonstrate the installation process:
Using pip:
$ pip install plotly==4.12.0Using conda:
$ conda install -c plotly plotly=4.12.0Optional dependencies and packages
Plotly may have optional dependencies for specific features or environments. Users should be aware of these dependencies and install them accordingly. For example, to use Plotly in Jupyter Notebook, the notebook and ipywidgets packages should be installed.
For Jupyter Notebook support, users need to install the required packages using the following commands:
Using pip:
$ pip install "notebook>=5.3" "ipywidgets>=7.2"Using conda:
$ conda install "notebook>=5.3" "ipywidgets>=7.2"Configuring Plotly for JupyterLab involves additional steps, including installing jupyterlab and ipywidgets packages, as well as JupyterLab extensions. These extensions provide support for rendering Plotly figures within JupyterLab. The process includes installing the necessary packages and extensions and running JupyterLab to enable Plotly integration.
Offline capabilities of plotly.py
In version 4, plotly.py shifted to an "offline-only" mode, meaning it no longer supports direct online operations such as uploading figures or data to cloud services like Chart Studio. Users can still create and visualize plots locally without an internet connection or the need for an account or payment.
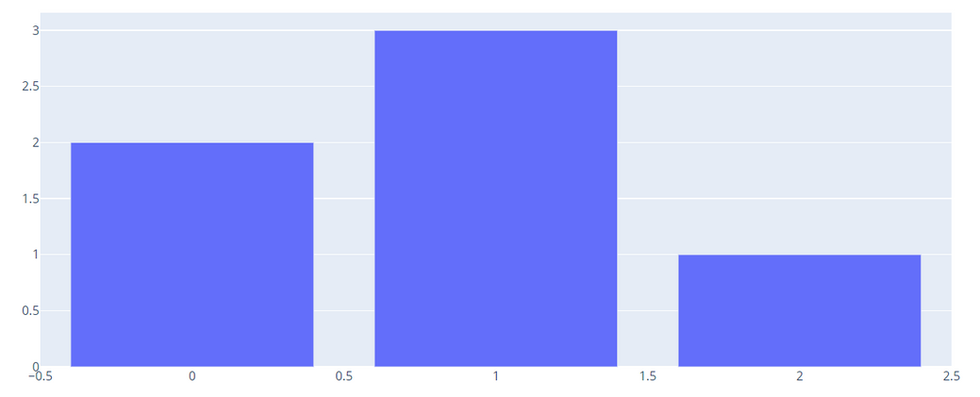
Here is the code demonstrating the creation of a simple bar chart using plotly.graph_objects:
# Import the required library
import plotly.graph_objects as go

# Create a bar chart
fig = go.Figure(data=go.Bar(y=[2, 3, 1]))

# Save the figure as an HTML file
fig.write_html('first_figure.html', auto_open=True)
In this code, a bar chart is created using the go.Figure class from plotly.graph_objects. The resulting plot is then saved as an HTML file (first_figure.html) using the fig.write_html method. The auto_open=True parameter indicates that the HTML file should be opened automatically after creation.
Functionalities and Capabilities of Plotly Python Library
1. Jupyter Notebook Support
Jupyter Notebook Support in Plotly refers to the capability of seamlessly integrating Plotly visualizations within Jupyter Notebooks. Users can create, display, and interact with Plotly charts directly in the Jupyter Notebook environment, enhancing the interactive data analysis experience.
Feature: Integration with Jupyter Notebooks, allowing users to create, display, and interact with Plotly visualizations directly within Jupyter Notebook environments.
Benefits: Seamless integration for data scientists and analysts working in Jupyter Notebooks, enhancing the interactive and exploratory data analysis experience.
To use Plotly in the classic Jupyter Notebook environment, follow these steps for installation and integration:
Install Dependencies:
Using pip:
$ pip install "notebook>=5.3" "ipywidgets>=7.2"Or using conda:
$ conda install "notebook>=5.3" "ipywidgets>=7.2"Run Jupyter Notebook:
Start the Jupyter Notebook by entering the following command in your terminal:
$ jupyter notebookDisplay Plotly Figures Inline:
With the Jupyter Notebook running, you can display Plotly figures inline using the notebook renderer. For example:
import plotly.graph_objects as go
fig = go.Figure(data=go.Bar(y=[2, 3, 1]))
fig.show()
Using FigureWidget Objects:
Alternatively, if you want to use FigureWidget objects, you can do so by importing the necessary modules. For example:
import plotly.graph_objects as go
fig = go.FigureWidget(data=go.Bar(y=[2, 3, 1]))
fig
2. JupyterLab Support (Python 3.5+)
JupyterLab Support indicates that Plotly is compatible with JupyterLab, an advanced interactive development environment for Jupyter Notebooks. This support extends Plotly's usability to users of JupyterLab, providing a modern and extensible interface for visualization tasks.
Feature: Compatibility and support for JupyterLab, an advanced interactive development environment for Jupyter Notebooks.
Benefits: Extends the usage of Plotly to JupyterLab users, providing a modern and extensible interface for creating and managing visualizations.
To use Plotly in JupyterLab, you need to follow these steps for installation and configuration:
Install Dependencies:
Using pip:
$ pip install jupyterlab "ipywidgets>=7.5"Or using conda:
$ conda install jupyterlab "ipywidgets=7.5"Install JupyterLab Extensions:
Run the following commands in your terminal (requires node to be installed):
# JupyterLab renderer support
jupyter labextension install jupyterlab-plotly@4.12.0

# OPTIONAL: Jupyter widgets extension
jupyter labextension install @jupyter-widgets/jupyterlab-manager plotlywidget@4.12.0
Run JupyterLab:
Start JupyterLab by entering the following command in your terminal:
$ jupyter labDisplay Plotly Figures Inline:
You can now display Plotly figures inline in JupyterLab using the plotly_mimetype renderer. For example:
import plotly.graph_objects as go
fig = go.Figure(data=go.Bar(y=[2, 3, 1]))
fig.show()
Using FigureWidget Objects:
If you executed the optional step for Jupyter widgets extension during installation, you can use FigureWidget objects. For example:
import plotly.graph_objects as go
fig = go.FigureWidget(data=go.Bar(y=[2, 3, 1]))
fig
Following these steps ensures that Plotly is integrated into JupyterLab, allowing you to create and display interactive Plotly figures seamlessly within the JupyterLab environment.
3. Static Image Export
Static Image Export in Plotly allows users to export Plotly visualizations as static images. This feature is valuable for saving and sharing visualizations in formats like PNG or JPEG, making it convenient for inclusion in documents, reports, or presentations.
Feature: Ability to export Plotly visualizations as static images, enabling users to save and share visualizations in image formats.
Benefits: Useful for incorporating Plotly visualizations into documents, reports, or presentations where static images are preferred or required.
plotly.py provides support for exporting static images, offering users two options:
The kaleido package, recommended and supported as of plotly version 4.9,
The orca command line utility (legacy as of plotly version 4.9).
Kaleido
Kaleido is a standalone, high-quality image export service that doesn't have external dependencies. It's designed for simplicity and ease of use, making it the recommended choice for static image export in plotly.py.
The kaleido package is the preferred choice for static image export. It has no dependencies and can be easily installed using either pip or conda.
$ pip install -U kaleido
or conda.
$ conda install -c plotly python-kaleido
Orca
Orca is a legacy command-line utility for static image export. It was the primary tool before Kaleido, and while it is still supported, Kaleido is now recommended due to its simplicity and compatibility.
While Kaleido is recommended for its ease of installation and broader compatibility, static image export can still be achieved using the legacy orca command line utility along with the psutil Python package.
Both dependencies can be installed together using conda:
$ conda install -c plotly plotly-orca==1.3.1 psutilAlternatively, psutil can be installed using pip:
$ pip install psutil4. Extended Geo Support
Extended Geo Support in Plotly enhances the library's capabilities for geographic visualizations. It includes features that rely on large geographic shape files, enabling users to create complex geographic visualizations like choropleth maps or other map-based representations.
Feature: Enhanced support for geographic visualizations, including features that rely on large geographic shape files.
Benefits: Enables users to create visualizations related to geographical data, such as choropleth maps, leveraging extended geo support for more complex mapping scenarios.
Certain features in plotly.py depend on substantial geographic shape files, such as the county choropleth figure factory.
To access these shape files, users can install the plotly-geo package. The installation can be done using either pip or conda. Here are the commands for both methods:
Using pip:
$ pip install plotly-geo==1.0.0Using conda:
$ conda install -c plotly plotly-geo=1.0.0By installing the plotly-geo package, users ensure they have the necessary geographic shape files to leverage specific geographical features and visualizations within Plotly.
5. Chart Studio Support
Chart Studio Support refers to Plotly's integration with Chart Studio, a platform that allows users to upload Plotly figures to Plotly's Chart Studio Cloud or On-Prem services. This integration facilitates collaborative visualization sharing and provides cloud-based hosting for Plotly visualizations.
Feature: Integration with Chart Studio, allowing users to upload Plotly figures to Plotly's Chart Studio Cloud or On-Prem services.
Benefits: Facilitates collaboration and sharing of Plotly visualizations through the Chart Studio platform, providing cloud-based hosting and additional features for online visualization management.
To install this package, users can use either pip or conda. The following commands demonstrate how to install chart-studio using both methods:
Using pip:
$ pip install chart-studio==1.0.0Using conda:
$ conda install -c plotly chart-studio=1.0.0It's essential to note that the chart-studio package is optional. If not installed, users won't have the capability to upload their Plotly figures to the Chart Studio cloud service. In essence, this feature enables users to share, collaborate, and host their Plotly visualizations in the Chart Studio environment, providing an additional layer of functionality for those who choose to utilize it.
Dash Integration
Dash is an open-source framework for building analytical applications using Python. It is designed to simplify the process of creating interactive, web-based data visualizations and dashboards. Developed by Plotly, Dash allows users to build complex and feature-rich applications with just a few lines of Python code.
Dash applications are inherently web-based, making them accessible through browsers, and they don't require knowledge of web development languages like HTML or JavaScript.
Integrating Dash with the Plotly Graphing Library
One of the key strengths of Dash lies in its seamless integration with the Plotly graphing library. Plotly figures, which can be created using the Plotly Python library, can be effortlessly embedded into Dash applications. This integration enables users to leverage the extensive capabilities of Plotly for creating a wide array of interactive charts, maps, and graphs within their Dash applications.
The synergy between Dash and Plotly makes it easy for users to incorporate advanced data visualization components into their analytical applications.
Integrating Dash with Plotly involves several steps. Below is a step-by-step guide to help you integrate Dash with Plotly:
STEP 1: Install Necessary Packages:
Make sure you have both Dash and Plotly installed. You can install them using pip:
pip install dash plotlySTEP 2: Create a Plotly Figure:
Write code to create a Plotly figure using plotly.graph_objects or plotly.express.
STEP 3: Import Dash Components:
Import necessary components from Dash, including dash, dash_core_components, and dash_html_components.
STEP 4: Initialize Dash App:
Initialize a Dash app using dash.Dash().
STEP 5: Define Layout:
Define the layout of your Dash app. This includes specifying components and their arrangement. In this case, you'll use dcc.Graph to embed your Plotly figure.
STEP 6: Run the Dash App:
Run the Dash app using the run_server method. This starts a local development server.
Optionally, set debug=True for debugging and use_reloader=False if you're working inside a Jupyter environment.
STEP 7: View the App:
Open your web browser and navigate to the local address provided in the console (usually http://127.0.0.1:8050/).
Here's a minimal example of the code: The below code illustrates how to seamlessly integrate a Plotly figure, represented by the variable fig, into a Dash application.
Dash is a Python framework for creating web-based analytical applications
While Plotly is a powerful library for creating interactive visualizations.
The integration enables users to display the same Plotly figure within a Dash application, extending the utility of the visualizations created with Plotly to a web-based, interactive platform.
Code:
import plotly.graph_objects as go
import dash
import dash_core_components as dcc
import dash_html_components as html

# Create a Plotly Figure (replace with your own visualization code)
fig = go.Figure()

# Optionally, you can add traces or update the layout of the figure
# Example:
# fig.add_trace(go.Scatter(x=[1, 2, 3], y=[4, 1, 2], mode='lines'))

# Initialize a Dash app
app = dash.Dash()

# Define the layout of the Dash app
app.layout = html.Div([
    dcc.Graph(figure=fig)
])

# Run the Dash app
if __name__ == '__main__':
    app.run_server(debug=True, use_reloader=False)
This code creates a simple Dash app with a single dcc.Graph component, which embeds the Plotly figure (fig). Users can customize the Plotly figure by adding traces or updating the layout within the code.
To view the Dash app, execute the script, and it will run a local server accessible in a web browser. The integration allows for interactive data exploration and analysis beyond static plots. Users can adapt and extend this code to showcase their own Plotly visualizations in Dash applications for collaborative data exploration.
Conclusion
To sum up, Plotly in Python is a versatile library for creating interactive visuals. With its integration into Dash, it becomes even more powerful for building analytical apps. Easy installation and compatibility with Jupyter make it a go-to tool for dynamic data representation in Python.


Comments