An Introduction to DataFrame
- The Tech Platform

- Sep 14, 2020
- 7 min read
Last month, we announced .NET support for Jupyter notebooks, and showed how to use them to work with .NET for Apache Spark and ML.NET. Today, we’re announcing the preview of a DataFrame type for .NET to make data exploration easy. If you’ve used Python to manipulate data in notebooks, you’ll already be familiar with the concept of a DataFrame. At a high level, it is an in-memory representation of structured data. In this blog post, I’m going to give an overview of this new type and how you can use it from Jupyter notebooks. To play along, fire up a .NET Jupyter Notebook in a browser.
How to use DataFrame?
DataFrame stores data as a collection of columns. Let’s populate a DataFrame with some sample data and go over the major features. The full sample can be found on Github(C# and F#). To follow along in your browser, click here and navigate to csharp/Samples/DataFrame-Getting Started.ipynb(or fsharp/Samples/DataFrame-Getting Started.ipynb). To get started, let’s import the Microsoft.Data.Analysis package and namespace into our .NET Jupyter Notebook (make sure you’re using the C# or F# kernel):
Let’s make three columns to hold values of types DateTime, int and string.
PrimitiveDataFrameColumn<DateTime> dateTimes = new PrimitiveDataFrameColumn<DateTime>("DateTimes"); // Default length is 0.
PrimitiveDataFrameColumn<int> ints = new PrimitiveDataFrameColumn<int>("Ints", 3); // Makes a column of length 3. Filled with nulls initially
StringDataFrameColumn strings = new StringDataFrameColumn("Strings", 3); // Makes a column of length 3. Filled with nulls initially
PrimitiveDataFrameColumn is a generic column that can hold primitive types such as int, float, decimal etc. A StringDataFrameColumn is a specialized column that holds string values. Both the column types can take a length parameter in their constructors and are filled with null values initially. Before we can add these columns to a DataFrame though, we need to append three values to our dateTimes column. This is because the DataFrame constructor expects all its columns to have the same length.
// Append 3 values to dateTimes
dateTimes.Append(DateTime.Parse("2019/01/01"));
dateTimes.Append(DateTime.Parse("2019/01/01"));
dateTimes.Append(DateTime.Parse("2019/01/02"));
Now we’re ready to create a DataFrame with three columns.
DataFrame df = new DataFrame(dateTimes, ints, strings); // This will throw if the columns are of different lengthsOne of the benefits of using a notebook for data exploration is the interactive REPL. We can enter df into a new cell and run it to see what data it contains. For the rest of this post, we’ll work in a .NET Jupyter environment. All the sample code will work in a regular console app as well though.
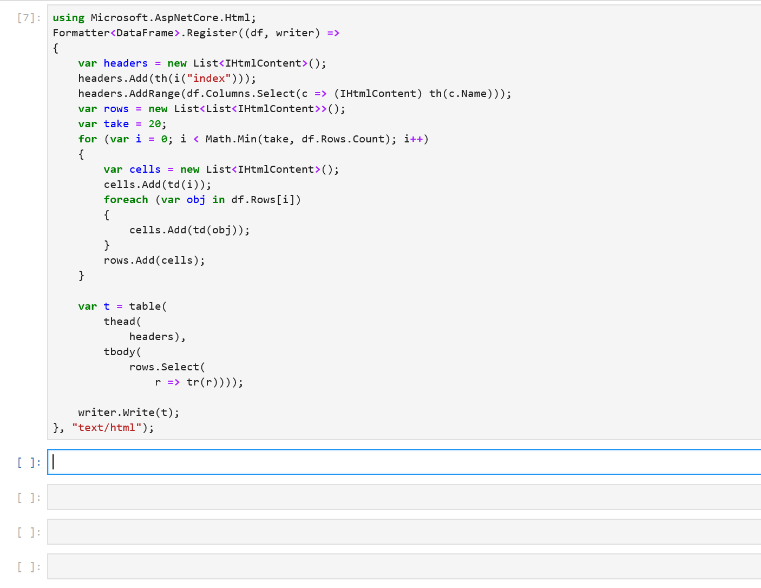
We immediately see that the formatting of the output can be improved. Each column is printed as an array of values and we don’t see the names of the columns. If df had more rows and columns, the output would be hard to read. Fortunately, in a Jupyter environment, we can write custom formatters for types. Let’s write a formatter for DataFrame.
using Microsoft.AspNetCore.Html;
Formatter<DataFrame>.Register((df, writer) =>
{
    var headers = new List<IHtmlContent>();
    headers.Add(th(i("index")));
    headers.AddRange(df.Columns.Select(c => (IHtmlContent) th(c.Name)));
    var rows = new List<List<IHtmlContent>>();
    var take = 20;
    for (var i = 0; i < Math.Min(take, df.Rows.Count); i++)
    {
        var cells = new List<IHtmlContent>();
        cells.Add(td(i));
        foreach (var obj in df.Rows[i])
        {
            cells.Add(td(obj));
        }
        rows.Add(cells);
    }

    var t = table(
        thead(
            headers),
        tbody(
            rows.Select(
                r => tr(r))));

    writer.Write(t);
}, "text/html");
This snippet of code register a new DataFrame formatter. All subsequent evaluations of df in a notebook will now output the first 20 rows of a DataFrame along with the column names. In the future, the DataFrame type and other libraries that target Jupyter as one of their environments will be able to ship with their formatters.
Sure enough, when we re-evaluate df, we see that it contains the three columns we created previously. The formatting makes it much easier to inspect our values. There’s also a helpful index column in the output to quickly see which row we’re looking at. Let’s modify our data by indexing into df:
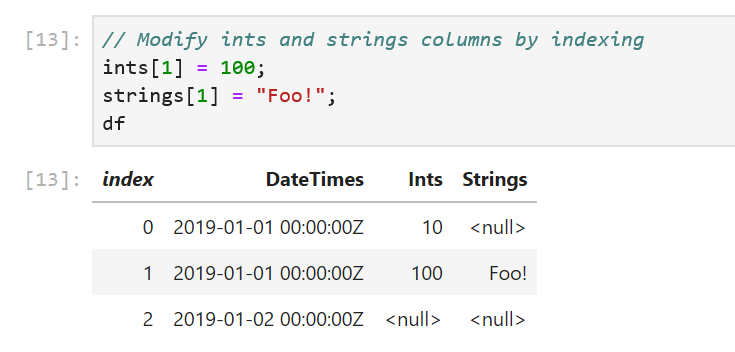
df[0, 1] = 10; // 0 is the rowIndex, and 1 is the columnIndex. This sets the 0th value in the Ints columns to 10We can also modify the values in the columns through indexers defined on PrimitiveDataFrameColumn and StringDataFrameColumn:
// Modify ints and strings columns by indexing
ints[1] = 100;
strings[1] = "Foo!";
One caveat to keep in mind here is the data type of the value passed in to the indexers. We passed in the right data types to the column indexers in our sample: an integer value of 100 to ints[1] and a string "Foo!" to string[1]. If the data types don’t match, an exception will be thrown. For cases where the type of data in the columns is not obvious, there is a handy DataType property defined on each column. The Info method displays the DataType and Length properties of each column:
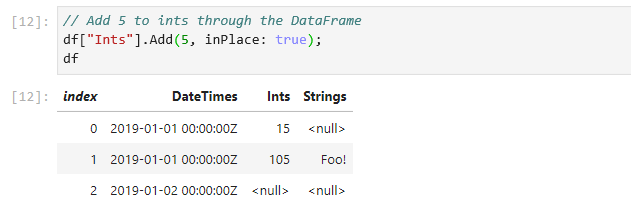
The DataFrame and DataFrameColumn classes expose a number of useful APIs: binary operations, computations, joins, merges, handling missing values and more. Let’s look at some of them:
// Add 5 to Ints through the DataFrame
df["Ints"].Add(5, inPlace: true);
// We can also use binary operators. Binary operators produce a copy, so assign it back to our Ints column
df["Ints"] = (ints / 5) * 100;All binary operators are backed by functions that produces a copy by default. The + operator, for example, calls the Add method and passes in false for the inPlace parameter. This lets us elegantly manipulate data using operators without worrying about modifying our existing values. For when in place semantics are desired, we can set the inPlace parameter to true in the binary functions.
In our sample, df has null values in its columns. DataFrame and DataFrameColumn offer an API to fill nulls with values.
df["Ints"].FillNulls(-1, inPlace: true);
df["Strings"].FillNulls("Bar", inPlace: true);
DataFrame exposes a Columns property that we can enumerate over to access our columns and a Rows property to access our rows. We can index Rows to access each row. Here’s an example that accesses the first row:
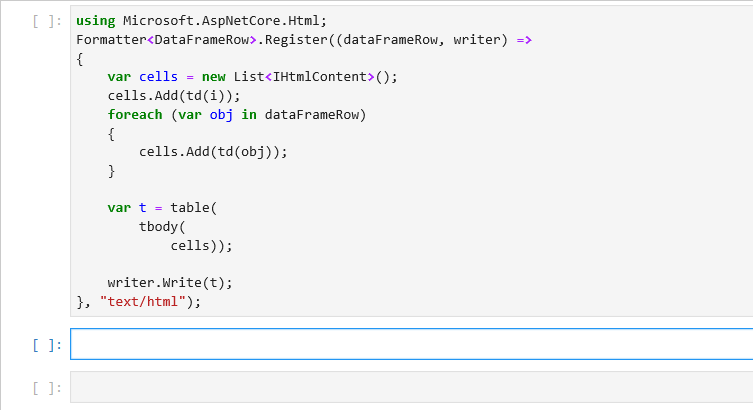
DataFrameRow row0 = df.Rows[0];To inspect our values better, let’s write a formatter for DataFrameRow that displays values in a single line.
using Microsoft.AspNetCore.Html;
Formatter<DataFrameRow>.Register((dataFrameRow, writer) =>
{
    var cells = new List<IHtmlContent>();
    cells.Add(td(i));
    foreach (var obj in dataFrameRow)
    {
        cells.Add(td(obj));
    }

    var t = table(
        tbody(
            cells));

    writer.Write(t);
}, "text/html");
To enumerate over all the rows in a DataFrame, we can write a simple for loop. DataFrame.Rows.Count returns the number of rows in a DataFrame and we can use the loop index to access each row.
for (long i = 0; i < df.Rows.Count; i++)
{
       DataFrameRow row = df.Rows[i];
}
Note that each row is a view of the values in the DataFrame. Modifying the values in the row object modifies the values in the DataFrame. We do however lose type information on the returned row object. This is a consequence of DataFrame being a loosely typed data structure.
Let’s wrap up our DataFrame API tour by looking at the Filter, Sort, GroupBy methods:
// Filter rows based on equality
PrimitiveDataFrameColumn<bool> boolFilter = df["Strings"].ElementwiseEquals("Bar");
DataFrame filtered = df.Filter(boolFilter);
ElementwiseEquals returns a PrimitiveDataFrameColumn<bool> filled with a true for every row that equals "Bar" in the Strings column, and a false when it doesn’t equal "Bar". In the df.Filter call, each row corresponding to a true value in boolFilter selects a row out of df. The resulting DataFrame contains only these rows.
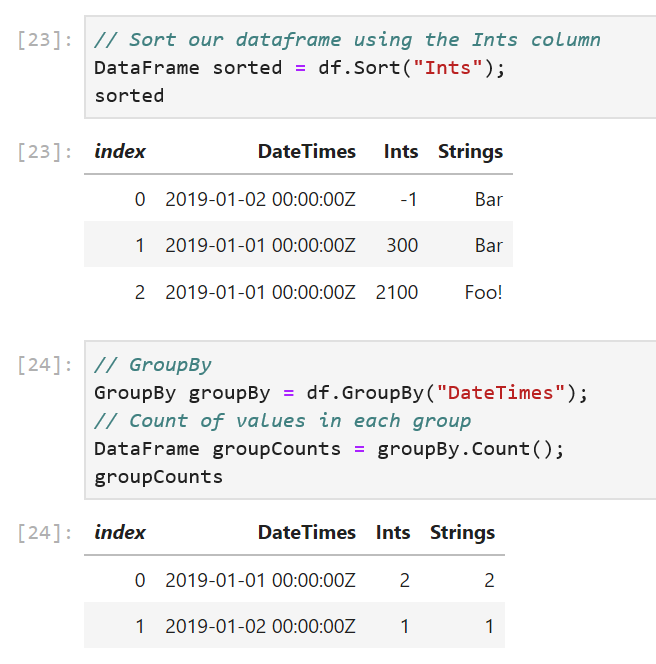
// Sort our dataframe using the Ints column
DataFrame sorted = df.Sort("Ints");
// GroupBy
GroupBy groupBy = df.GroupBy("DateTimes");
The GroupBy method takes in the name of a column and creates groups based on unique values in the column. In our sample, the DateTimes column has two unique values, so we expect one group to be created for 2019-01-01 00:00:00Z and one for 2019-01-02 00:00:00Z.
// Count of values in each group
DataFrame groupCounts = groupBy.Count();
// Alternatively find the sum of the values in each group in Ints
DataFrame intGroupSum = groupBy.Sum("Ints");
The GroupBy object exposes a set of methods that can called on each group. Some examples are Max(), Min(), Count() etc. The Count() method counts the number of values in each group and return them in a new DataFrame. The Sum("Ints") method sums up the values in each group.
Finally, when we want to work with existing datasets, DataFrame exposes a LoadCsv method.
DataFrame csvDataFrame = DataFrame.LoadCsv("path/to/file.csv");Charting
Another cool feature of using a DataFrame in a .NET Jupyter environment is charting. XPlot.Plotly is one option to render charts. We can import the XPlot.Plotly namespace into our notebook and create interactive visualizations of the data in our DataFrame. Let’s populate a
PrimitiveDataFrameColumn<double> with a normal distribution and plot a histogram of the samples:
#r "nuget:MathNet.Numerics,4.9.0"
using XPlot.Plotly;
using System.Linq;
using MathNet.Numerics.Distributions;

double mean = 0;
double stdDev = 0.1;
MathNet.Numerics.Distributions.Normal normalDist = new Normal(mean, stdDev);

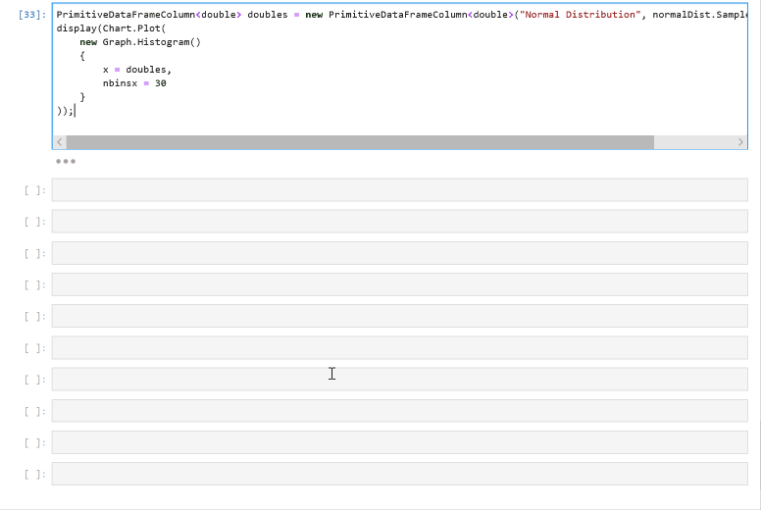
PrimitiveDataFrameColumn<double> doubles = new PrimitiveDataFrameColumn<double>("Normal Distribution", normalDist.Samples().Take(1000));
display(Chart.Plot(
    new Graph.Histogram()
    {
        x = doubles,
        nbinsx = 30
    }
));
We first create a PrimitiveDataFrameColumn<double> by drawing 1000 samples from a normal distribution and then plot a histogram with 30 bins. The resulting chart is interactive! Hovering over the chart reveals the underlying data and lets us inspect each value precisely.
Summary
We’ve only explored a subset of the features that DataFrame exposes. Append, Join, Merge, and Aggregations are supported. Each column also implements IEnumerable<T?>, so users can write LINQ queries on columns. The custom DataFrame formatting code we wrote has a simple example. The complete source code(and documentation) for Microsoft.Data.Analysis lives on GitHub. In a follow up post, I’ll go over how to use DataFrame with ML.NET and .NET for Spark. The decision to use column major backing stores (the Arrow format in particular) allows for zero-copy in .NET for Spark User Defined Functions (UDFs)!
We always welcome the community’s feedback! In fact, please feel free to contribute to the source code. We’ve made it easy for users to create new column types that derive from DataFrameColumn to add new functionality. Support for structs such as DateTime and user defined structs is also not as complete as primitive types such as int, float etc. We believe this preview package allows the community to do data analysis in .NET. Try out DataFrame in a .NET Jupyter Notebook and let us know what you think!
Source: Microsoft














Comments